Mapping Coastal Erosion Using LiDAR
Anonym
Last week at the Esri UC I spoke on using LiDAR to map coastal erosion in the aftermath of Hurricane Sandy. The area of focus was a section of Fire Island, a barrier Island along the coast of Long Island in New York. According to USGS, Hurricane Sandy caused approximately 30 years worth of coastal damage as it passed up the eastern seaboard, with average dunes erosion in the realm of 22 meters horizontally, and as much as 5 meter losses in elevation in some places.In the study area, the island was breached and a new inlet was created by the pounding wind and waves from the storm. LiDAR provides a great tool for assessing volumetric change over an area, and a combination of ENVI and ENVI LiDAR were used to assess changes in the area.
The first step was to get some data. The National Centers for Coastal Ocean Science, which is the research office of the NOAA National Ocean Service, was able to provide me with pre and post-event LiDAR coverage of my study area.
Data courtesy of NOAA
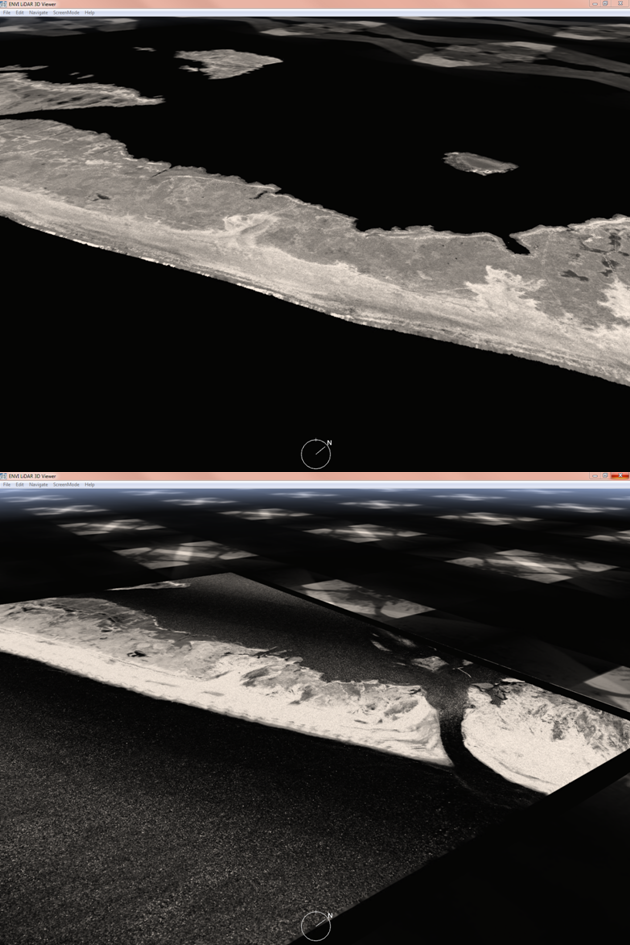
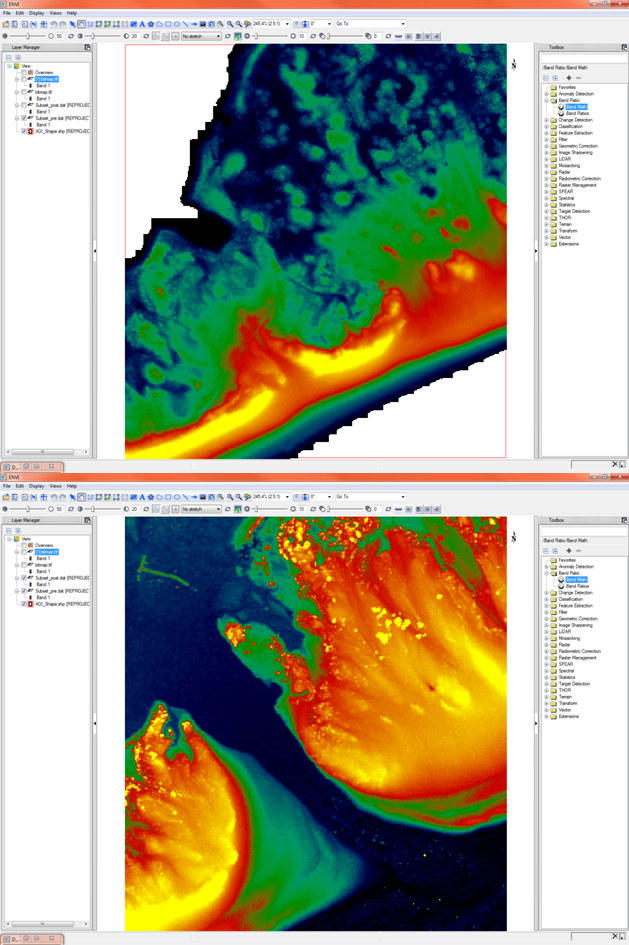
The elevation model was automatically extracted from the point cloud using ENVI LiDAR, then pushed to ENVI and classified by height in an effort to better visualize the change that had taken place and the extent of that change. Below we can see the before and after data sets as classified in ENVI. Note that while the hurricane caused some drastic erosion in the area of the channel, a large amount of sand was also deposited to the sides of the channel as a result from the storm.
Data courtesy of NOAA
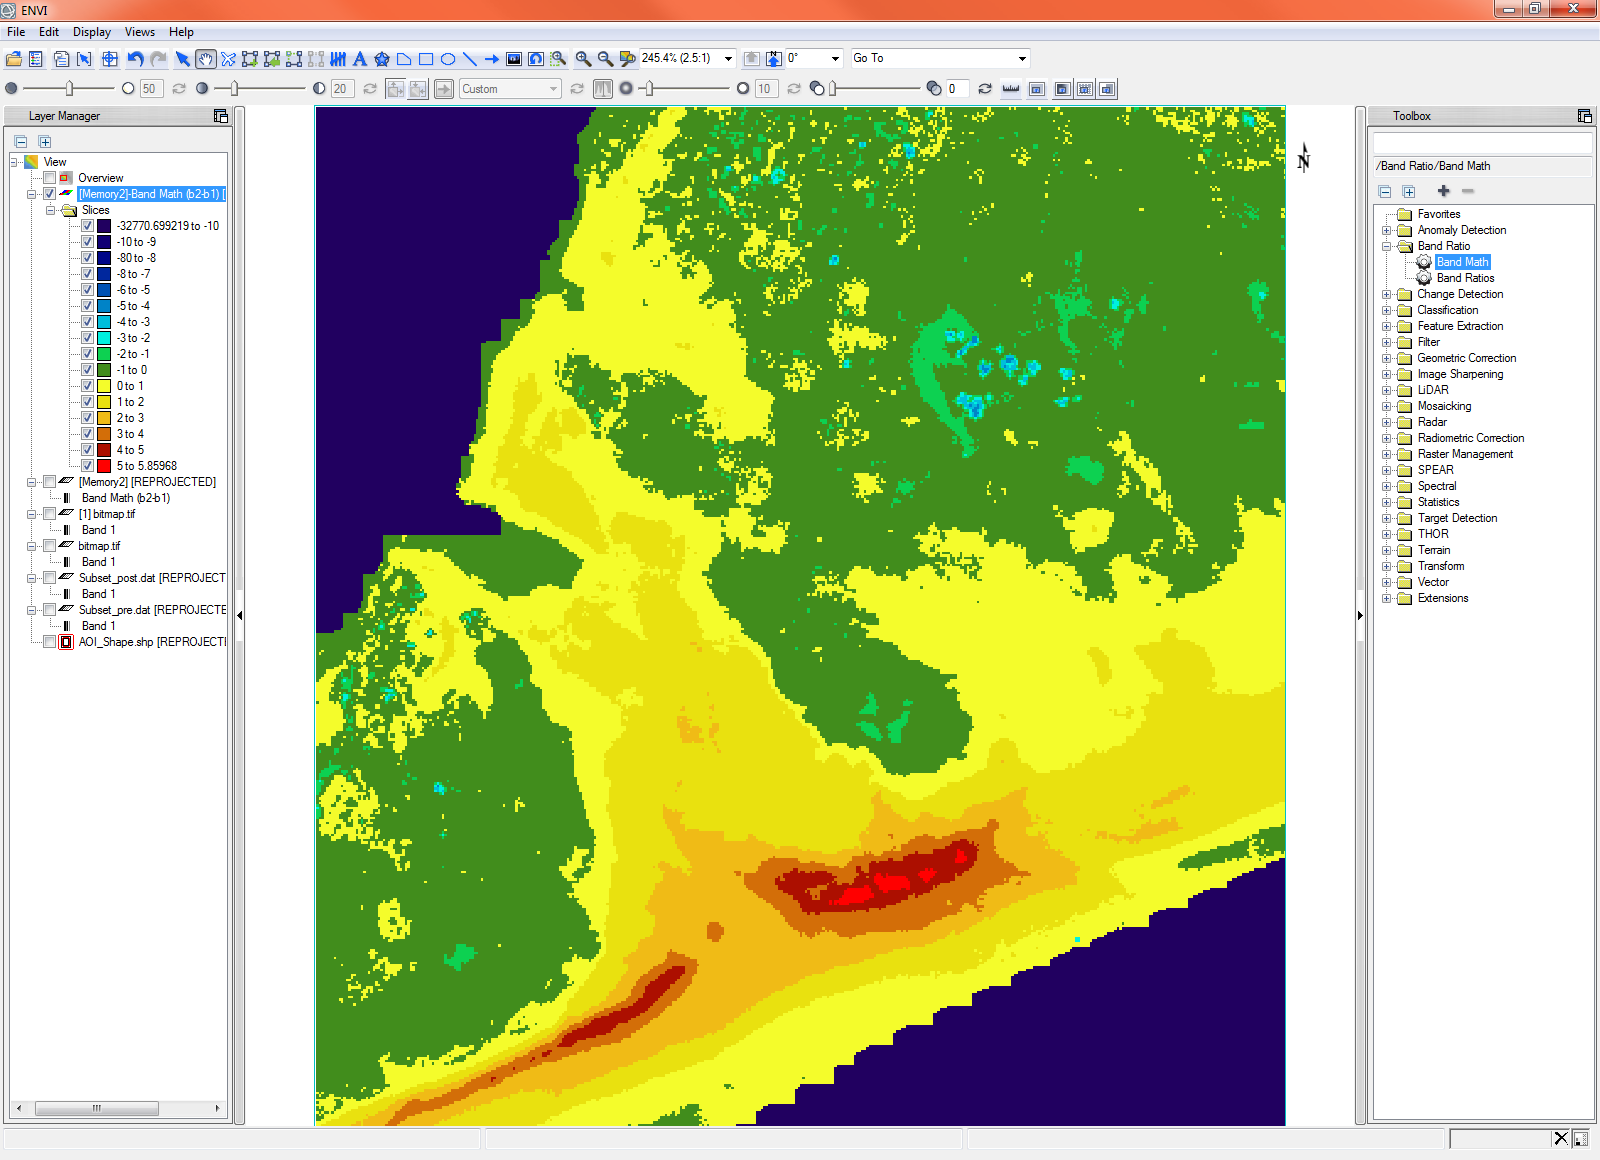
Once the images were classified, a quick band math allowed for a volumetric map of sediment loss in the area by subtracting the height of the after image from the height of the before image. Below is the resulting map depicting the volumetric loss of sediment due to the storm. In this image areas of red and yellow show erosion and areas in green show areas where sediment was deposited.
This kind of a map can be very useful in assessing the amount of sand that has been removed from, or deposited in, an area. This information is very useful for creating recovery plans to repair a damaged area, for developing mitigation plans for this and other similar areas to minimize the impact of erosion due to future events, and to estimate the costs of executing such plans. This kind of map is useful for state and local governments, as well as disaster response teams.
Data courtesy of NOAA
How do you use LiDAR? What interesting problems are being solved today with LiDAR that might not have been using it in the past? For more information feel free to contact us.