Using ENVI SARscape and Sentinel-1 Data to Measure Ground Displacement from the Cumbre Vieja Volcanic Eruption
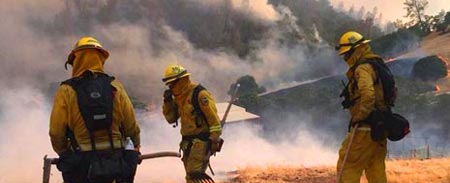
The Cumbre Vieja volcano erupted on the Spanish Canary Island of La Palma on September 19, 2021. The eruption followed an earthquake swarm that started under Cumbre Vieja on September 11 and slowly migrated to the surface, resulting in earthquakes that registered around 3.5 on the Richter scale. In the week that followed the eruption, the lava flow from the volcano buried some 230 hectares and more than 500 buildings, and destroyed over 18 kilometers of roads, displacing 6,000 people.
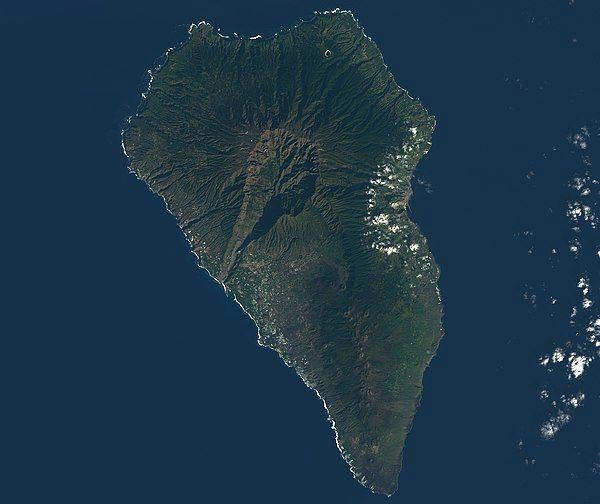
Landsat 8 image of La Palma & La Gomera Islands, Canary Islands
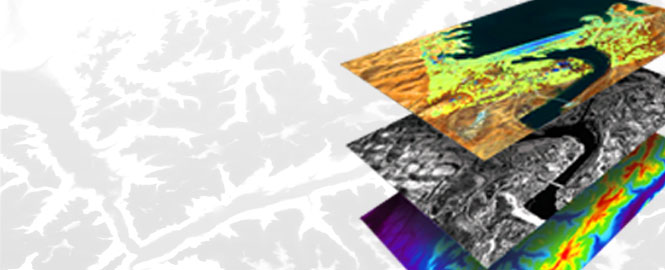
Volcanic eruptions pose a significant hazard and can trigger natural disasters on a local and global scale. Past eruptions have disrupted air traffic and caused significant damage to the global economy. Remote sensing, and in particular, Synthetic Aperture Radar (SAR) data, is being used to forecast, monitor and manage volcanic hazards. SAR provides high-resolution, day-and-night and weather-independent images that are well-suited to monitor vast areas with limited above-ground distinct features such as volcanos. SAR is also used to view areas optical satellites have trouble covering such as smoke or cloud-covered areas. This is because SAR sensors can penetrate through smoke and clouds and do not need sunlight to capture a scene.
ENVI® SARscape® is able to analyze SAR data to measure surface movement making it an ideal combination for monitoring and understanding volcanoes. For example, as internal pressure of magma increases, the volcano's surface will bulge up and out. After an eruption occurs, the deformation is reversed. The scale of volcanic deformation can be at the centimeter or meter scale over many square kilometers. Differential interferometry performed using ENVI SARscape is able to accurately capture the dense spatial sampling over the areas of displacement.
Following the eruption in La Palma, an Interferometric Synthetic Aperture Radar (InSAR) study was performed using ENVI SARscape and Sentinel-1 data of both ascending and descending passes to quantify the ground deformation. Combining ascending and descending collections of the satellite (whether it is traveling up or down the surface of the Earth) provides a better understanding of surface movement. The ascending interferometric pair used was composed of images acquired on September 14 and another on September 20, while the descending pair was composed of images from September 16 and September 22.
Good quality interferograms were obtained where the displacement signal was strong and clean, indicating some deformations in the Las Manchas area. Assuming the deformation developed during a short period of time around the initial eruption, a deformation map was created for the vertical and horizontal directions.
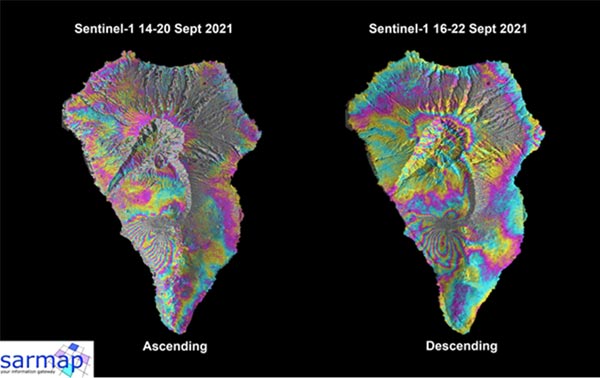
Figure 1) The image on the left is a line-of-sight ascending interferogram while the image on the right is a descending interferogram. The large number of interferometric fringes in both images indicates a deformation effect on the southern part of the island.
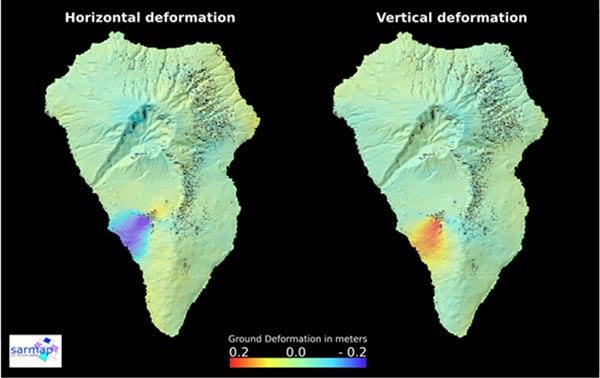
Figure 2) The horizontal displacement map (left) shows negative displacement values (in meters) in the west direction. The vertical deformation map (right) shows positive values correspond to uprising.
Additionally, the characteristics of the source were estimated using the Okada model, (a surface displacement model specifically for magma movement). Geophysical modeling consists of describing the characteristics of the source causing the event (volcanic eruptions, earthquakes, explosions, etc.), defining the geometrical characteristics of the source itself (position in depth, size, orientation, etc.) and the behavior/kinematics that are causing the surface deformation (not a surface deformation model, but instead a model describing the source in depth which is causing the surface deformations).
The modeling consists of a two-step inversion approach, starting from the surface deformation measurements (obtained from SAR data, GPS, leveling, etc.) that are the input parameters to be inverted to define the characteristics of the source through an optimization approach which is minimizing the difference between the observed deformations (from SAR data) and the modeled ones.
Volcanic behavior is generally modeled through a Mogi source (Mogi, 1958) which consists of a spherical source used to simulate the magma chamber volume change, which is causing the typical inflation/deflation of the craters in the surface. In this specific case, the pattern of deformations obtained from Sentinel-1 SAR data indicates a dike intrusion, which can be modeled using an Okada model. This analytical source is used to predict the surface displacement induced by a rectangular dislocation in homogeneous and elastic half-space (Okada, 1985). It is adopted in the modeling of earthquakes, sills, dike intrusions, etc. Model parameters required to describe its geometry and kinematic. To reproduce the dike intrusion effects, a single source characterized by an opening kinematics has been considered.
Within an inversion process, a Non-Linear Inversion is used to obtain all the geometrical parameters of the uniform opening source; the resulting source is then subdivided into elements, whose opening values are retrieved by Linear Inversion. This provides a more realistic source model.
The optimization has been performed using both the ascending and descending deformation maps to better constrain the modeling step through two independent datasets that measured the event deformations.
The distribution of the opening as shown in the following image finding its maximum of 2.5618 m at -48.4 m.
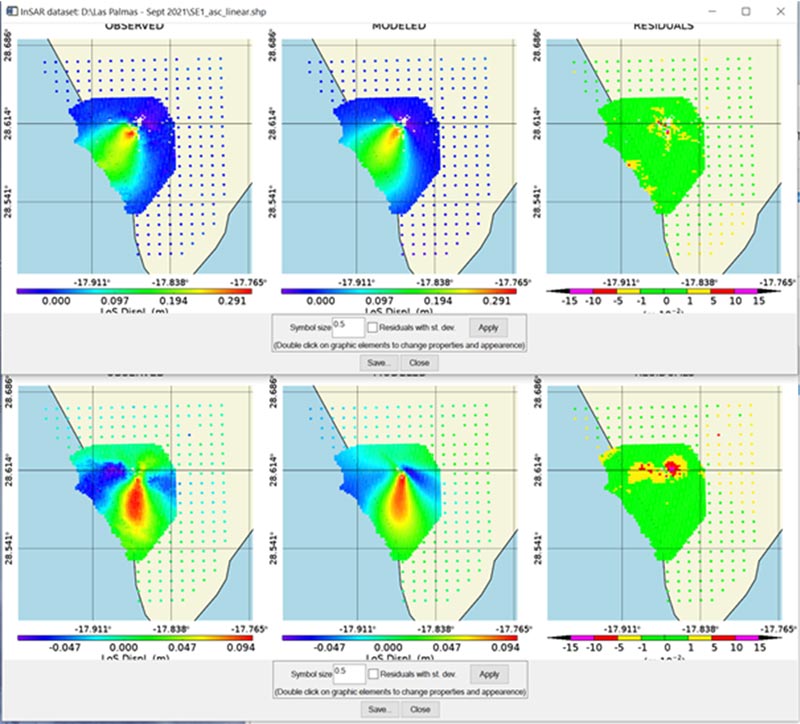
Figure 3) The above maps show the results of the inversion optimization comparing the observed deformations (surface deformations obtained from Sentinel-1 data), the modeled deformations through the Okada modeling and the residual deformations which shows a spatially uncorrelated shows spatially uncorrelated behavior confirming the model adequacy.
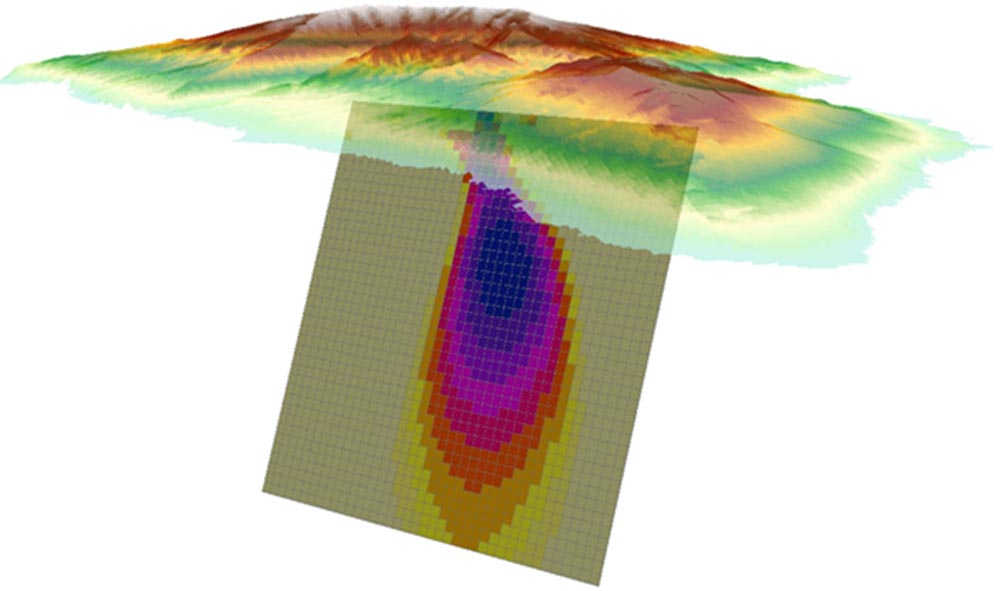
Figure 4) This image shows the opening distribution of the source in depth.
This InSAR study was performed by sarmap S.A. and Instituto Nazionale di Geofisica e Vulcanologia (INGV) with the support of NV5 Geospatial and Esri España.
For more information please visit the ENVI SARscape page. If you have an application for SAR data and analysis and want to talk with one of our SAR experts, email us at GeospatialInfo@NV5.com.
SAR THREE-PART SERIES
Learn Synthetic Aperture Radar (SAR) applications and benefits.

SAR WEBINAR
Surface Motion Monitoring Using SAR Interferometric Techniques
RECORDED WEBINAR
Effectively Use Geospatial Data in the Disaster Management Cycle