17337
ENVI 5.0: Applying Raster Color Slices or Density Slices
ENVI 5.0 has changed the name of the density slice functionality to raster color slices. The tool output is still a raster of color mapped pixel values and can be treated as a classification image in subsequent processing.
There are several ways to access the raster color slice utility in ENVI:
§ In the Layer Manager, right-click the raster name and select Raster Color Slices. Select the input file and band in the Select Input File dialog.
§ In the Data Manager, right-click on the band to use as input and select Load Raster Color Slices.
§ From the Toolbox, select Classification > Raster Color Slices. Select the input file and band in the Select Input File dialog.
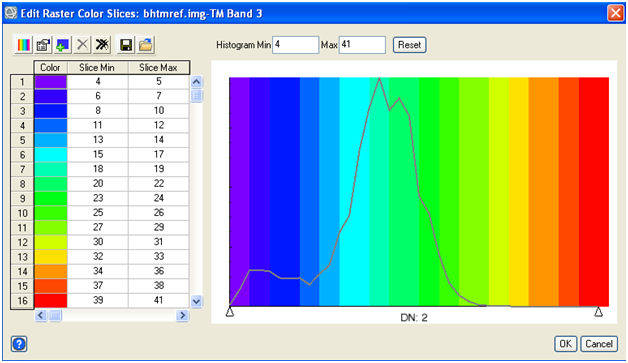
Any of these will bring up the following dialogue with the default data range, color table, and number of slices:
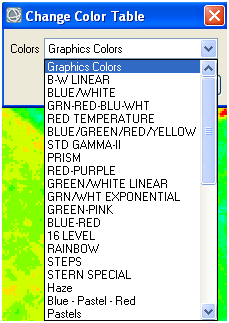
 “Change Color Table…” Will allow you to chose among predefined color tables:
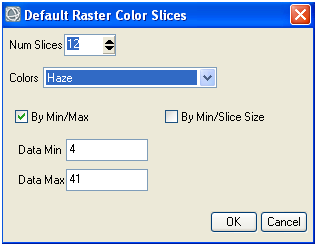
 “New Default Color Slices…” Will allow you to change the number of slices and the values to which they are mapped.
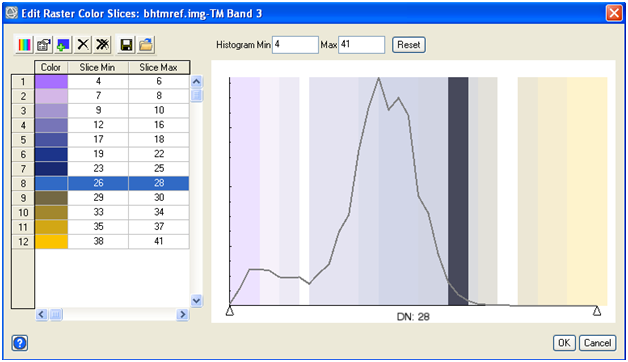
A new feature in ENVI 5.0 is the ability to graphically shift color slices. You can highlight the slice you would like to change in the graph as below, then move the boundaries of the slice to change the slice min and max.
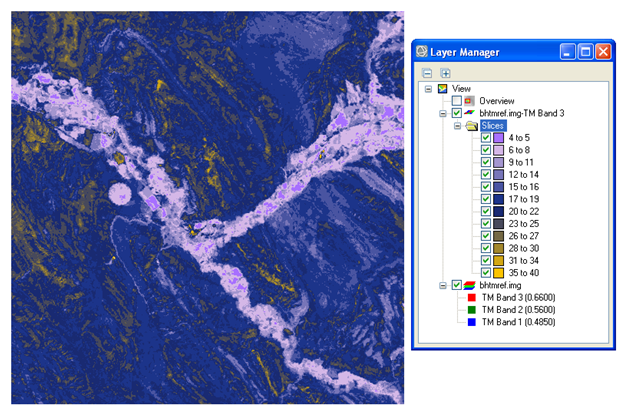
When finished, click OK and the resultant image will appear in the active view with the slices appearing in the Layer Manager:
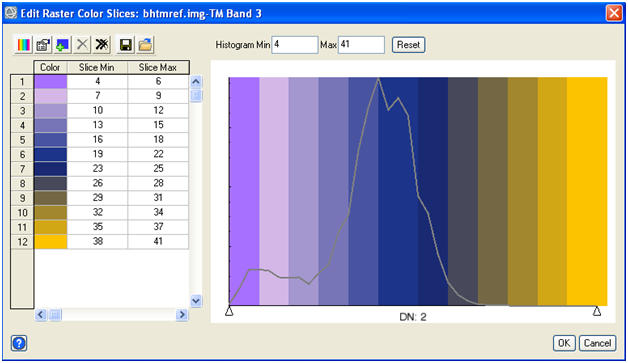
If you would like to change the color slices, right click on the Slices folder and select Edit Color Slices… This will allow you to change the existing slices rather than generate a new layer. This raster can also be exported to a class image or shapefile by right clicking on the Slices folder in the Layer Manager and selecting Export Color Slices. Statistics can also be obtained for any or all of the slices by right clicking on either the slice of interest or the Slices folder.
Reviewed 10/15/14 by PS