The Many Band Combinations of Landsat 8
Anonym
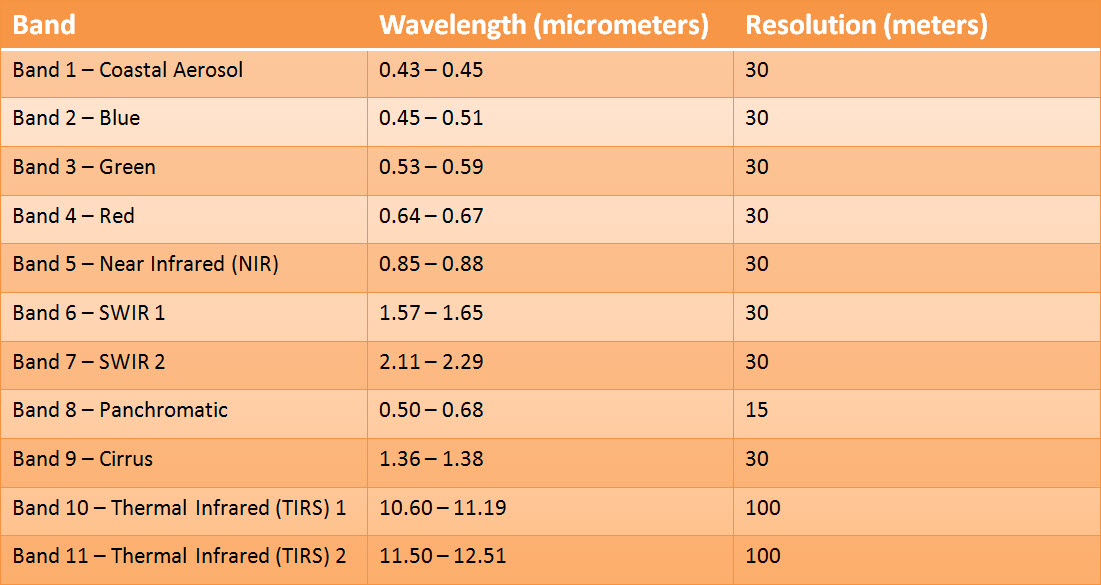
Landsat 8 is the most recent satellite in the Landsat program. The data quality (signal-to-noise ratio) and radiometric quantization (12-bits) of the Landsat 8 Operational Land Imager (OLI) and Thermal Infrared Sensor (TIRS) are higher than previous Landsat instruments (8-bit for TM and ETM+). Since it's launch on February 11, 2013, Landsat 8 has been providing some truly stunning images of the earth's surface. Beyond their beauty, these images are packed with information which can be manipulated to extract features and discern changes to the earth's surface over time.
When working with Landsat imagery, a logical first step is to load an image into an image analysis program and begin to visualize what is in the scene. The OLI sensor aboard Landsat 8 has nine bands for capturing the spectral response of the earth's surface at discrete wavelengths along the electromagnetic spectrum. Additionally, the TIRS sensor aboard Landsat 8 collects information at two discrete wavelengths within the thermal infrared portion of the electromagnetic spectrum. These wavelengths have been chosen carefully based on years of scientific research.
Standard digital cameras are designed to replicate what we see with the human eye, so they capture light only in the red, green and blue wavelengths and then apply red, green and blue filters (also known as channels) to these wavelengths, respectively, that when combined generate a natural looking RGB image. With a multispectral image from a sensor system such as Landsat 8, we have a lot more information to work with. Different wavelengths can often help us discern some features better than others or even help us "see through" features such as clouds or smoke. For example, the Near Infrared (NIR) wavelength is one of the most commonly used wavelengths on multispectral sensors because vegetation reflects so strongly in this portion of the electromagnetic spectrum that this information proves very useful when performing vegetation analyses. The Shortwave Infrared (SWIR) bands aboard Landsat 8 are very useful for discerning differences in bare earth and for telling what is wet and what is dry in a scene. There are many other examples of the advantages of the available bands in Landsat images, but what I would like to do here is simply show how loading different combinations of these bands into the red, green and blue channels makes different features stand out. I am not the first to do this, but I just thought I would add an additional resource to the world wide web for showing how these band combinations can be used to visualize Landsat 8 images.
4 , 3 , 2 - Natural Color Image, Fresno, California
This band combination is as close to "true color" as you can get with a Landsat OLI image. One unfortunate drawback with this band combination is that these bands tend to be susceptible to atmospheric interference, so they sometimes appear hazy.
5, 4, 3 - Traditional Color Infrared (CIR) Image, Colorado/Utah
Note how vegetation really pops in red, with healthier vegetation being more vibrant. It's also easier to tell different types of vegetation apart than it is with a natural color image. This is a very commonly used band combination in remote sensing when looking at vegetation, crops and wetlands.
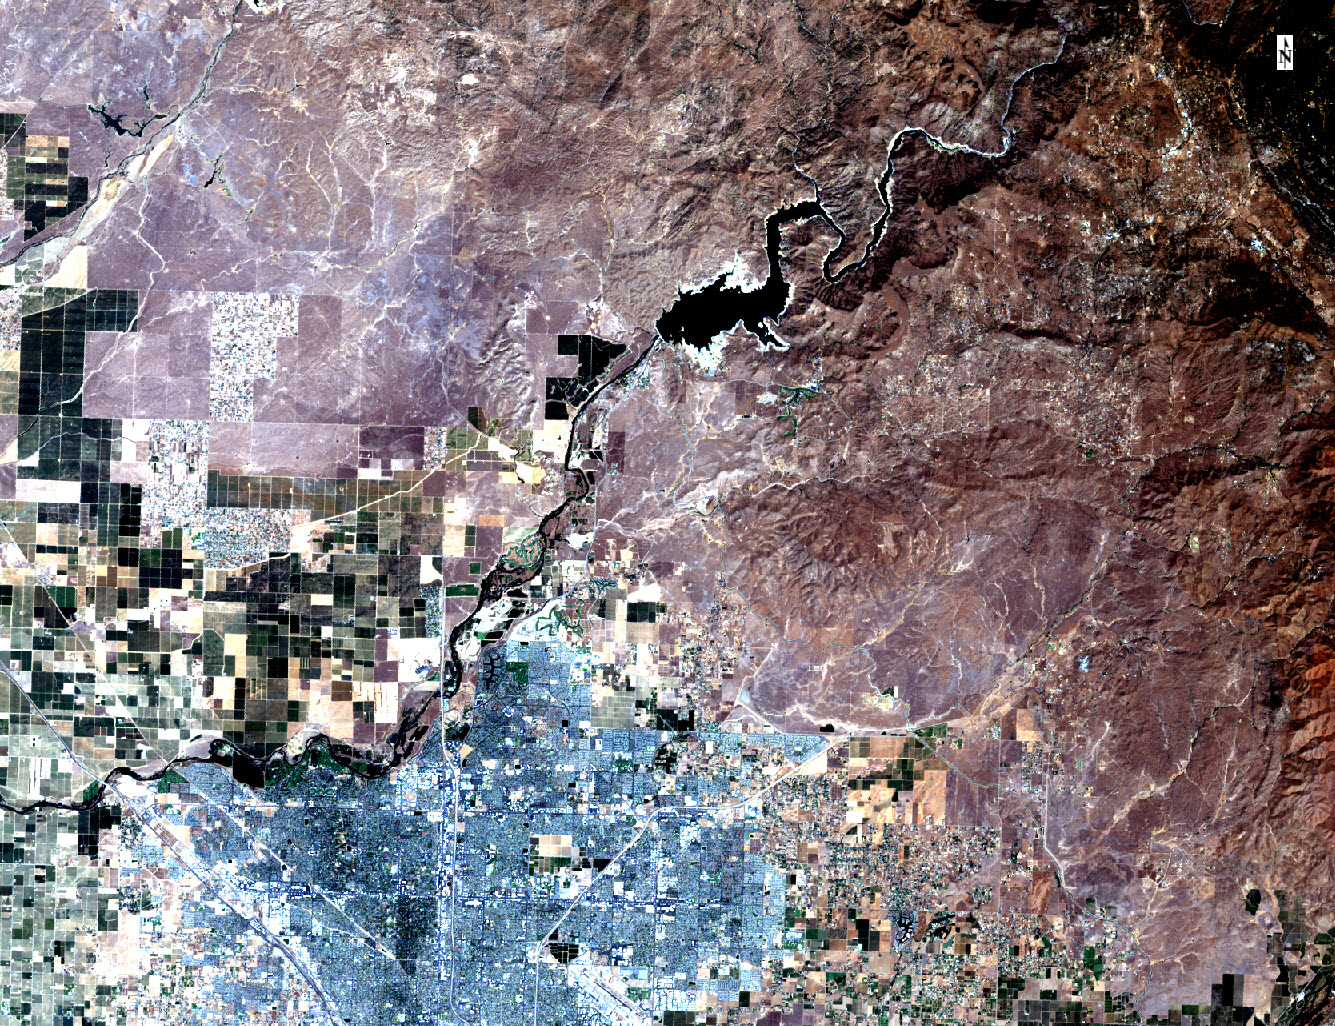
7, 6, 4 - False Color useful for visualizing urban environments, Los Angeles, California
Because this band combination makes use of both of the SWIR bands aboard Landsat 8, the image is much more crisp than band combinations that make use of bands in shorter wavelengths, which are more susceptible to haze.

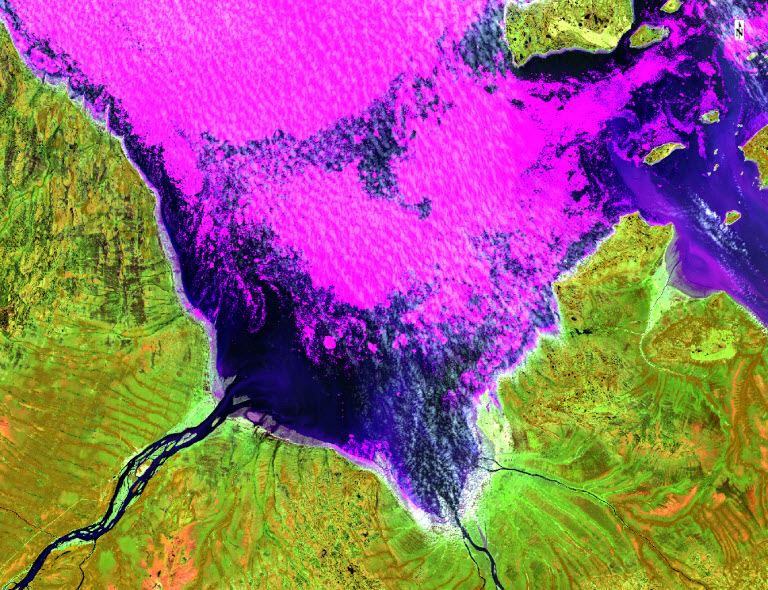
5, 6, 4 - False Color good for picking out land from water, Hudson Bay, Canada
In this false color image, land appears in shades of orange and green, ice stands out as a vibrant magenta color, and water appears in shades of blue.
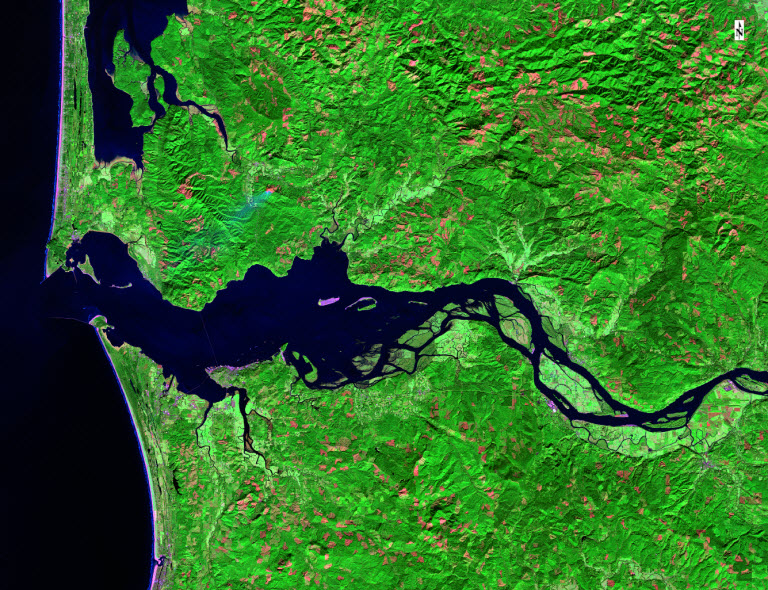
7, 5, 3 - False color image with good atmospheric penetration, Washington/Oregon
This band combination is similar to the 5, 6, 4 band combination shown above, but vegetation shows up in more vibrant shades of green. This band combination was used for the global Landsat mosaic created by NASA.
6, 5, 2 - False color for agriculture, Fruita, Colorado
This band combination is useful for the monitoring of agricultural crops, which appear as a vibrant green. Bare earth appears as a magenta color and non-crop vegetation appears as more subdued shades of green.
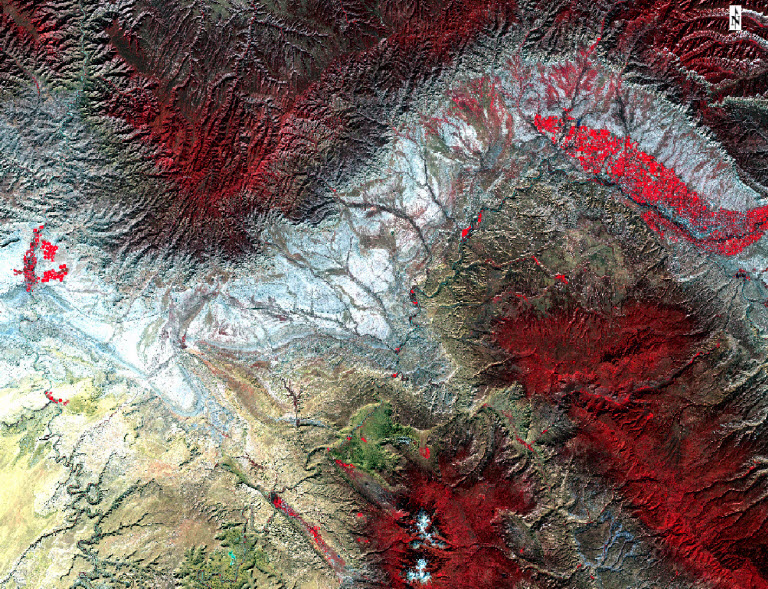
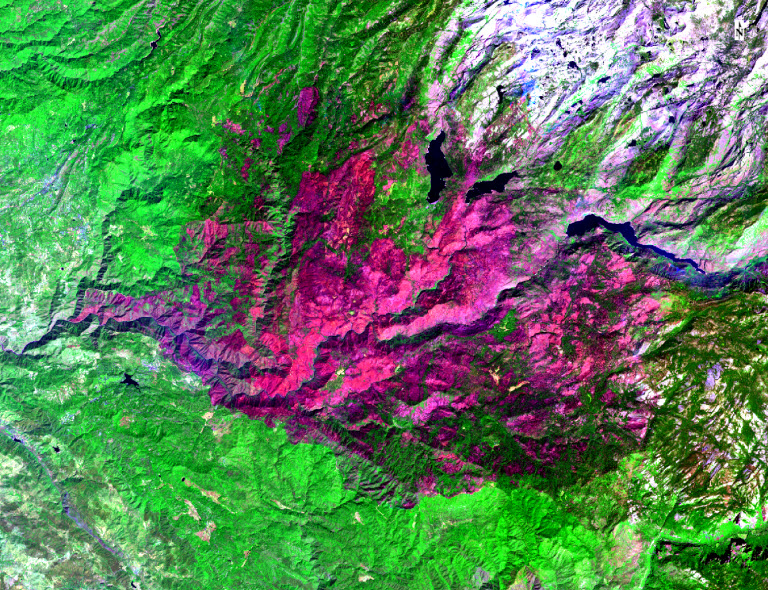
7, 5, 2 - False color often used for visualizing forest fire burn scars, Rim Fire, California
This band combination is similar to the 6, 5, 2 band combination shown above, but by pushing further into the SWIR range of the electromagnetic spectrum, there is less susceptibility to smoke and haze generated by a burning fire.
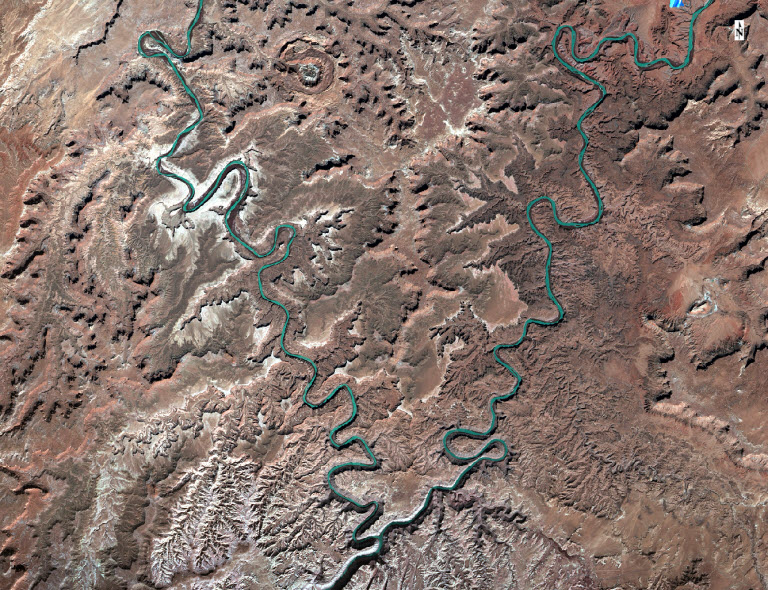
6, 3, 2 - False color for distinguishing differences in bare earth, Canyonlands NP, Utah
This band combination is good for discerning variations in a landscape that does not contain an abundance of vegetation. It is good for geologic applications.
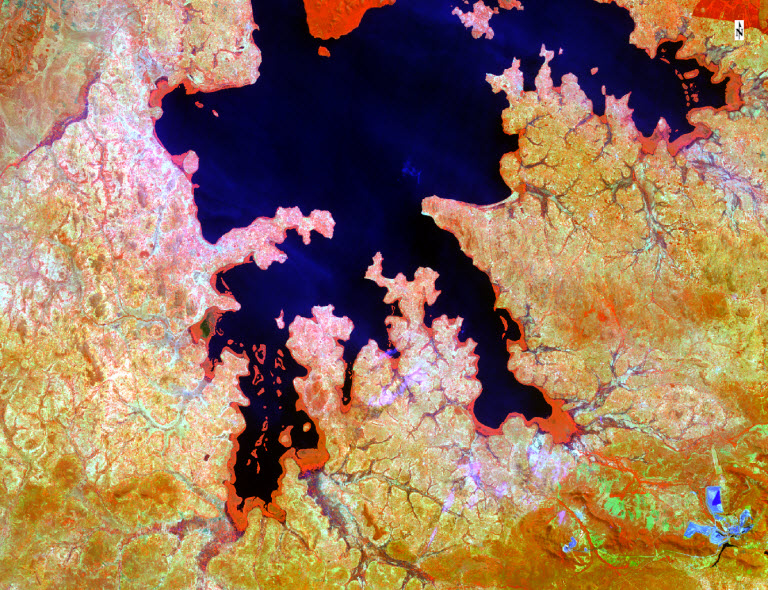
5, 7, 1 - False color for vegetation and water, Lake Victoria, Tanzania
This band combination makes use of the NIR, SWIR2, and Coastal Aerosol bands, respectively. The Coastal Aerosol band is unique to Landsat 8 and is used primarily to track fine particles like dust and smoke, and also to peer into shallow water. With this color combination, vegetation appears orange.
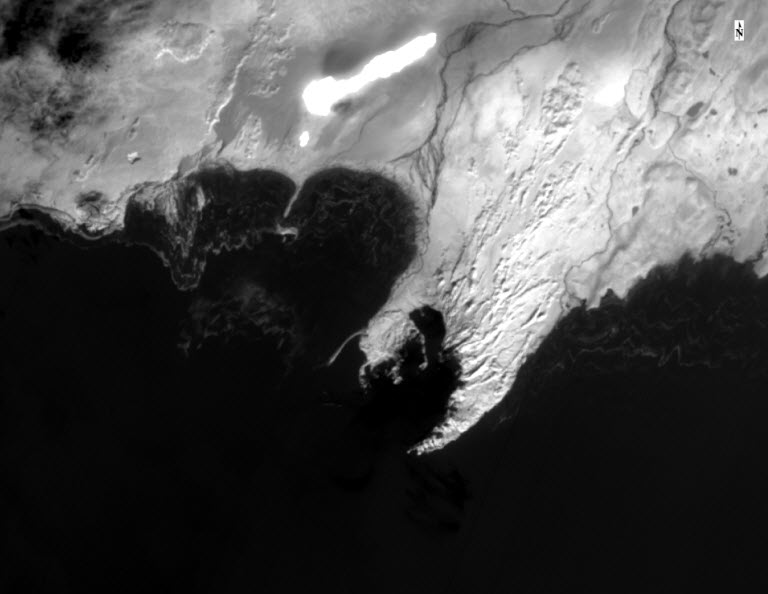
There are certainly several additional band combinations that would be useful for visualizing Landsat 8 scenes. In some situations, loading a grayscale image of a single band might also help to visualize specific features or phenomena. For example, in the grayscale image below, we are viewing the Thermal Infrared 1 band from the Landsat 8 TIRS sensor. This image, captured over Iceland, shows the Bardarbunga volcano in bright white in the top center of the image. Since we are using a thermal infrared band, this feature sticks out significantly from the ice sheet located just to the south of the lava flow.
With grayscale images, we also have the option of applying a color table to highlight features a little more clearly. In the image below we are viewing the same grayscale image of the Bardarbunga volcano, but now we have applied a color table that shows very cold extremes of the glacier in shades of deeper blue and very warm extremes of the lava flow in shades of deeper red.
There are many analysis techniques that can be applied to multispectral imagery to extract specific features of interest. These algorithms rely on the same principles of reflectivity and absorption at various wavelengths that allow us to see certain features when visualizing them with different band combinations. An important point to note is that if a particular band, or combination of bands, does a good job of helping you visualize a feature that is of interest to you, then it is highly likely that this band, or combination of bands, can be used to help you isolate that feature from your image. For more on this topic, please check out the section of our Documentation Center devoted to Spectral Indices.