Creating a Custom Three-Dimensional Visualization with ENVI + IDL
Anonym
This past week I decided to take some time to familiarize myself with some of the three-dimensional visualization tools available in ENVI + IDL.
Within the ENVI user interface, users can very quickly build a three-dimensional visualization of a scene by using the 3D SurfaceView tool which is available in the ENVI Toolbox. This is a great tool and offers a number of handy surface and motion controls for customizing a three-dimensional visualization. I have worked with this tool quite a bit over the years, but had always been curious about what could be done with a three-dimensional visualization if I leveraged the power of IDL.
IDL has a couple of three-dimensional functions that are particularly powerful and allow users to create fully customized three-dimensional visualizations. What I learned is that these functions allow users a tremendous amount of flexibility. In the example I discuss below, I used the CONTOUR function. The SURFACE function also offers some good options for creating three-dimensional surfaces in ENVI + IDL.
For this example, I downloaded a couple of 1/3 arc second USGS DEMs from the National Map Viewer. I first mosaicked the two DEMs and then resampled them slightly to decrease the file size so that they would be more performant in IDL. I then wrote the code which produces the three-dimensional representation. The code opens the DEM file, extracts information about lat/lon extent and pixel size, then draws a grid upon which elevation values can be plotted. Once I figured out how to get this to work, I chose an IDL color table to display elevation ranges, added contour lines, and made some fine-tuning adjustments to the axes labels. There are tons of different adjustments that can be made, so building a custom three-dimensional visualization really does allow users to use their imagination. For reference, my code is shown below:
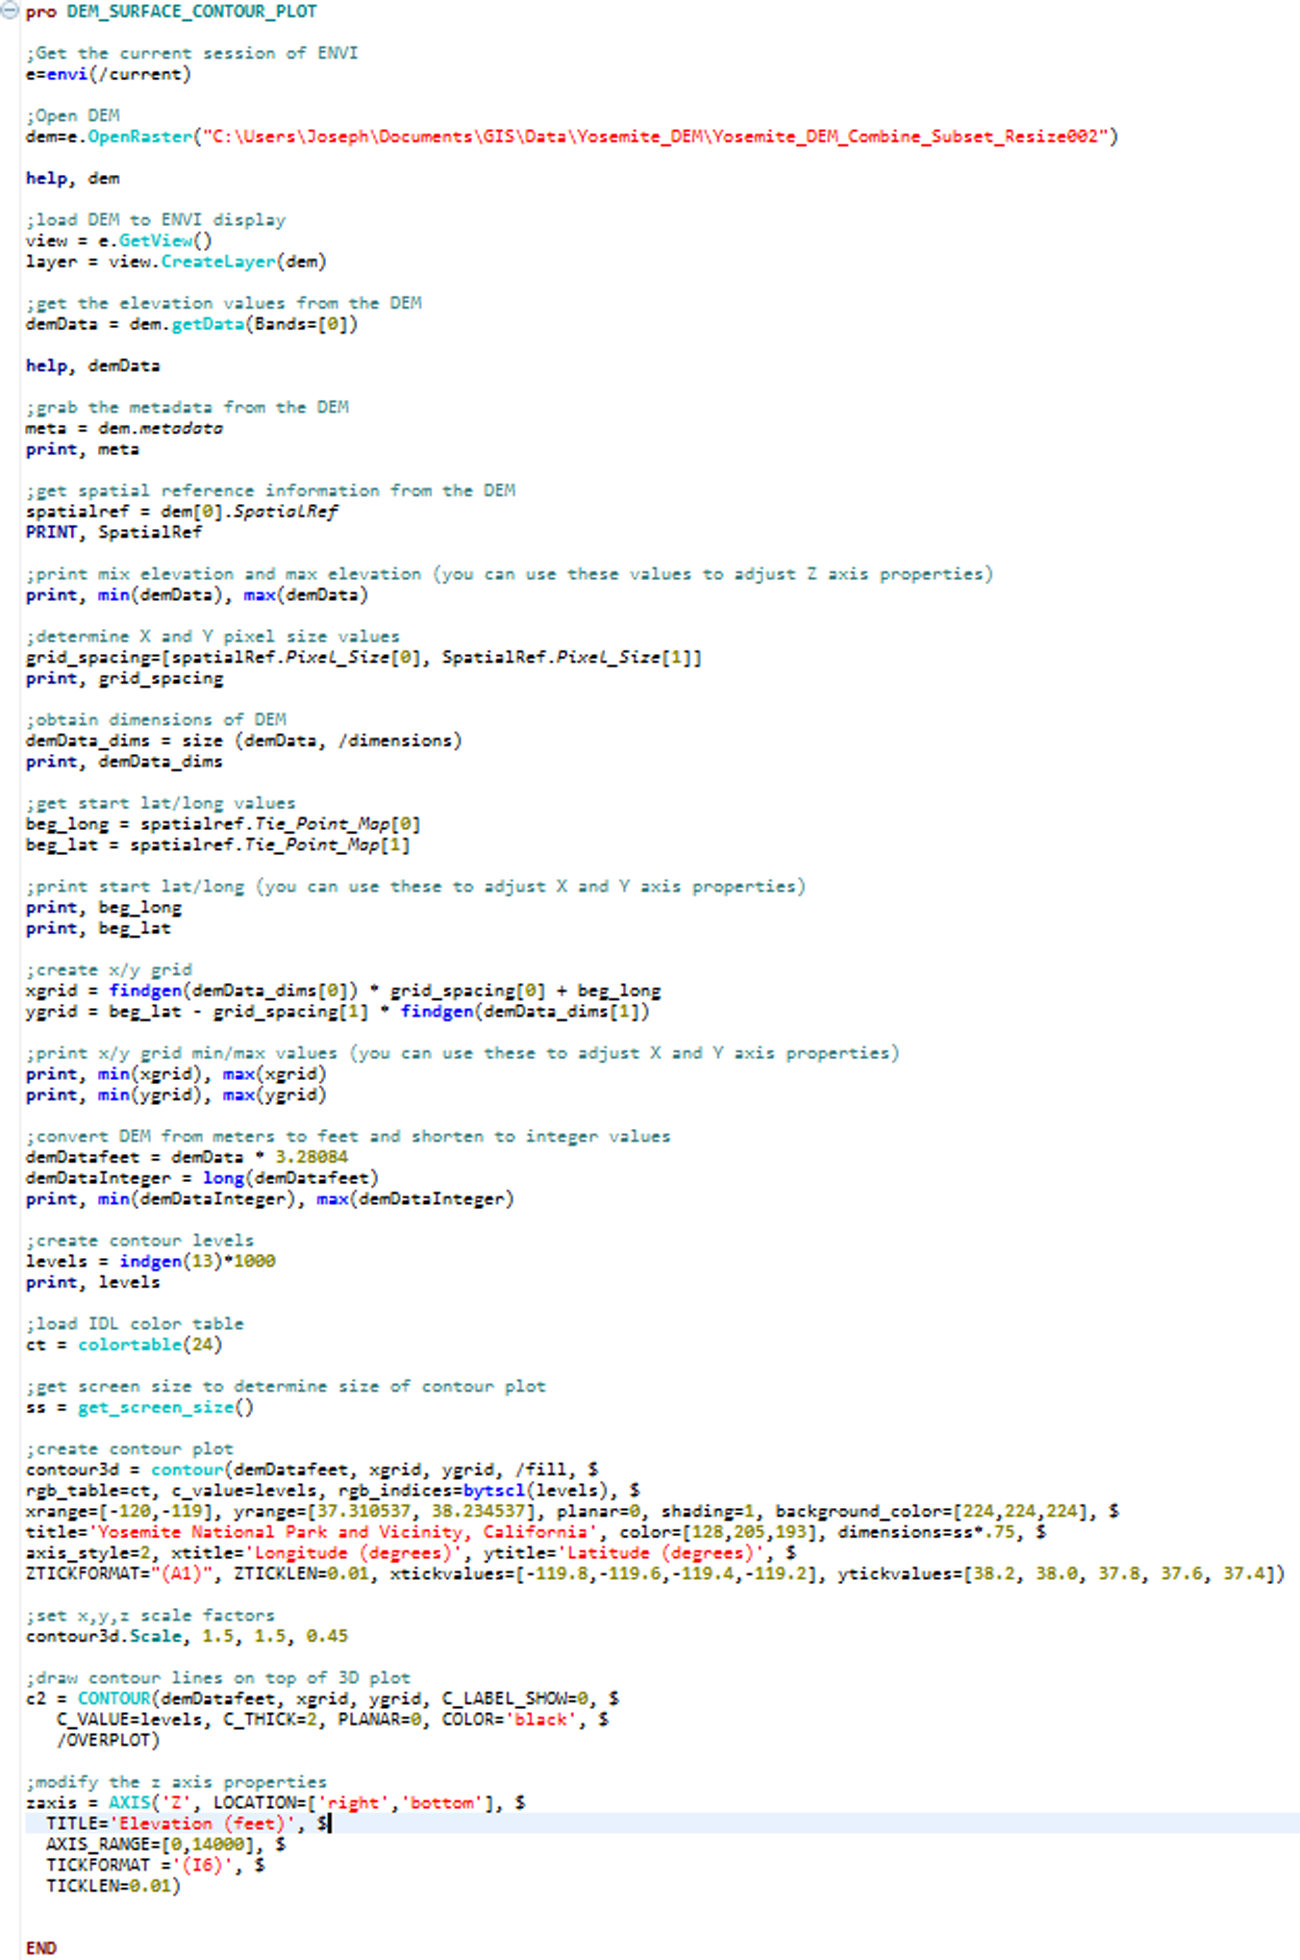
The nice thing about this code is that replicating this, or something similar, with other DEMs should be fairly easy. All it would require would be to change a couple of lines of code to match the extent of the new image and make some adjustments to the axes. The result of running this code on my DEM is shown below.
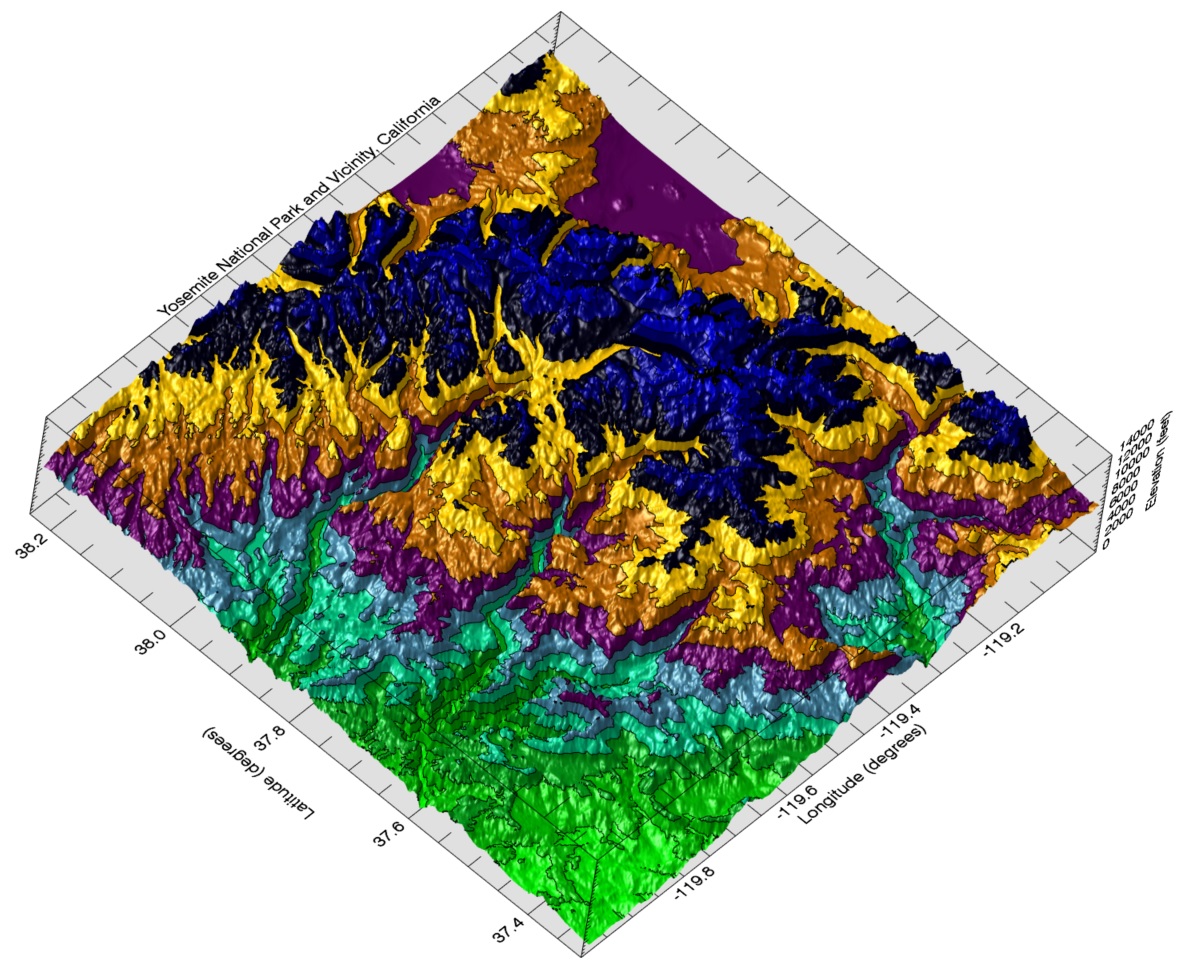
There are a lot of pretty cool things that can be done with the three-dimensional functions available in ENVI + IDL. For instance, in this example I plotted elevation values using a USGS DEM, but values that represent something completely different than elevation could have been plotted along the z-axis. This could make for some pretty cool and informative visualizations.
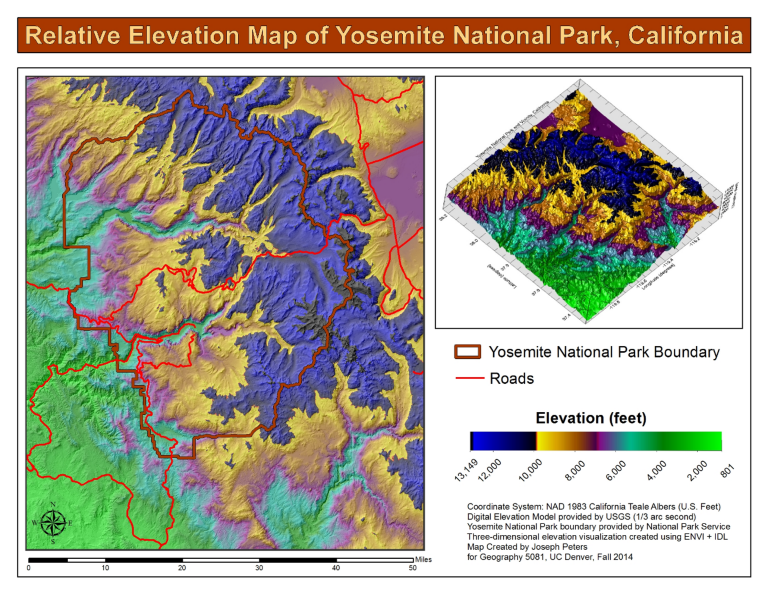
I also decided to make a map of my area using ENVI and ArcMap interoperability. I then inserted an image of my three-dimensional plot into the map. I think it gives a unique view of the scene. You can check out my map below. If you would like to see more examples of what can be done with the SURFACE and CONTOUR functions, check out our Documentation Center for more Graphics Examples.