X

NV5 Geospatial Blog

Each month, NV5 Geospatial posts new blog content across a variety of categories. Browse our latest posts below to learn about important geospatial information or use the search bar to find a specific topic or author. Stay informed of the latest blog posts, events, and technologies by joining our email list!


Thermal Infrared Echoes: Illuminating the Last Gasp of a Dying Star

Thermal Infrared Echoes: Illuminating the Last Gasp of a Dying Star

4/24/2025

This blog was written by Eli Dwek, Emeritus, NASA Goddard Space flight Center, Greenbelt, MD and Research Fellow, Center for Astrophysics, Harvard & Smithsonian, Cambridge, MA. It is the fifth blog in a series showcasing our IDL® Fellows program which supports passionate retired IDL users who may need support to continue their work... Read More >

A New Era of Hyperspectral Imaging with ENVI® and Wyvern’s Open Data Program

A New Era of Hyperspectral Imaging with ENVI® and Wyvern’s Open Data Program

2/25/2025

This blog was written in collaboration with Adam O’Connor from Wyvern.   As hyperspectral imaging (HSI) continues to grow in importance, access to high-quality satellite data is key to unlocking new insights in environmental monitoring, agriculture, forestry, mining, security, energy infrastructure management, and more.... Read More >

Ensure Mission Success With the Deployable Tactical Analytics Kit (DTAK)

Ensure Mission Success With the Deployable Tactical Analytics Kit (DTAK)

2/11/2025

In today’s fast-evolving world, operational success hinges on real-time geospatial intelligence and data-driven decisions. Whether it’s responding to natural disasters, securing borders, or executing military operations, having the right tools to integrate and analyze data can mean the difference between success and failure.... Read More >

How the COVID-19 Lockdown Improved Air Quality in Ecuador: A Deep Dive Using Satellite Data and ENVI® Software

How the COVID-19 Lockdown Improved Air Quality in Ecuador: A Deep Dive Using Satellite Data and ENVI® Software

1/21/2025

The COVID-19 pandemic drastically altered daily life, leading to unexpected environmental changes, particularly in air quality. Ecuador, like many other countries, experienced significant shifts in pollutant concentrations due to lockdown measures. In collaboration with Geospace Solutions and Universidad de las Fuerzas Armadas ESPE,... Read More >

Rapid Wildfire Mapping in Los Angeles County

Rapid Wildfire Mapping in Los Angeles County

1/14/2025

On January 8, WorldView-3 shortwave infrared (SWIR) imagery captured the ongoing devastation of the wildfires in Los Angeles County. The data revealed the extent of the burned areas at the time of the capture, offering critical insights for rapid response and recovery. To analyze the affected region, we utilized a random forest... Read More >

1345678910Last
«May 2025»
SunMonTueWedThuFriSat
27282930123
45678910
11121314151617
18192021222324
25262728293031
1234567
22667 Rate this article:
4.0

A cool magnetic field visualization

Anonym

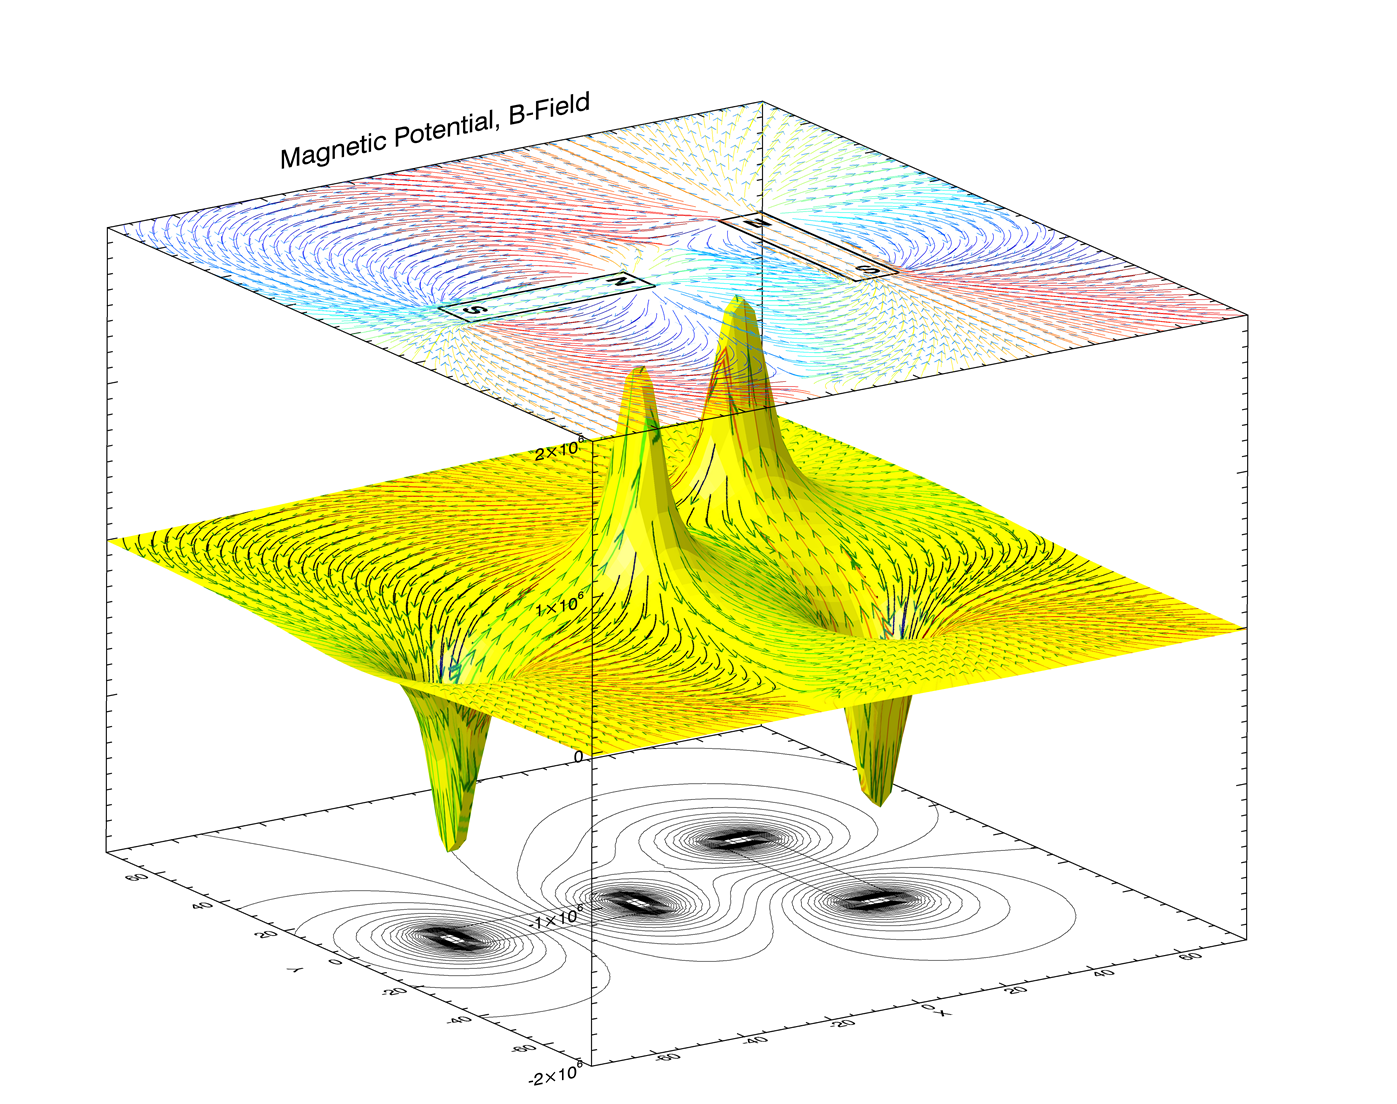
Carmen Lucas, a scientist at DRDC Atlantic in Dartmouth, NS, created this visualization with IDL:

A magnetic field visualization created by Carmen Lucas / DRDC Atlantic.

(click to embiggen)​

Carmen explains that this is:

... the magnetic scalar potential surface and contour, and associated magnetic flux density vector field B. Note the flux density field getting "pumped" uphill inside the two magnets as shown on the surface plot.

It's been awhile since I've shown a cool visualization made with IDL, so thank you, Carmen, for sharing this!

1 comments on article "A cool magnetic field visualization"

Avatar image

Dr. Purnanand

Dear Dr. Lucas, Nice graphics.. I am also looking to generate these type of figures, however with different tilt angels (I mean second figure has to be titled vertically), for a research paper. Your advice is highly solicited. I will be thankful to you if you can provide code to me, so that my work will be easy.

Thanks in advance....

Please login or register to post comments.