X

NV5 Geospatial Blog

Each month, NV5 Geospatial posts new blog content across a variety of categories. Browse our latest posts below to learn about important geospatial information or use the search bar to find a specific topic or author. Stay informed of the latest blog posts, events, and technologies by joining our email list!


NV5 at ESA’s Living Planet Symposium 2025

NV5 at ESA’s Living Planet Symposium 2025

9/16/2025

We recently presented three cutting-edge research posters at the ESA Living Planet Symposium 2025 in Vienna, showcasing how NV5 technology and the ENVI® Ecosystem support innovation across ocean monitoring, mineral exploration, and disaster management. Explore each topic below and access the full posters to learn... Read More >

Monitor, Measure & Mitigate: Integrated Solutions for Geohazard Risk

Monitor, Measure & Mitigate: Integrated Solutions for Geohazard Risk

9/8/2025

Geohazards such as slope instability, erosion, settlement, or seepage pose ongoing risks to critical infrastructure. Roads, railways, pipelines, and utility corridors are especially vulnerable to these natural and human-influenced processes, which can evolve silently until sudden failure occurs. Traditional ground surveys provide only periodic... Read More >

Geo Sessions 2025: Geospatial Vision Beyond the Map

Geo Sessions 2025: Geospatial Vision Beyond the Map

8/5/2025

Lidar, SAR, and Spectral: Geospatial Innovation on the Horizon Last year, Geo Sessions brought together over 5,300 registrants from 159 countries, with attendees representing education, government agencies, consulting, and top geospatial companies like Esri, NOAA, Airbus, Planet, and USGS. At this year's Geo Sessions, NV5 is... Read More >

Not All Supernovae Are Created Equal: Rethinking the Universe’s Measuring Tools

Not All Supernovae Are Created Equal: Rethinking the Universe’s Measuring Tools

6/3/2025

Rethinking the Reliability of Type 1a Supernovae   How do astronomers measure the universe? It all starts with distance. From gauging the size of a galaxy to calculating how fast the universe is expanding, measuring cosmic distances is essential to understanding everything in the sky. For nearby stars, astronomers use... Read More >

Using LLMs To Research Remote Sensing Software: Helpful, but Incomplete

Using LLMs To Research Remote Sensing Software: Helpful, but Incomplete

5/26/2025

Whether you’re new to remote sensing or a seasoned expert, there is no doubt that large language models (LLMs) like OpenAI’s ChatGPT or Google’s Gemini can be incredibly useful in many aspects of research. From exploring the electromagnetic spectrum to creating object detection models using the latest deep learning... Read More >

1345678910Last
«September 2025»
SunMonTueWedThuFriSat
31123456
78910111213
14151617181920
21222324252627
2829301234
567891011
16037 Rate this article:
4.0

Creating Image Tiles in ENVI

Anonym

I want to preview a new feature that will be available in the upcoming ENVI 6.0 release: a series of “Dice Raster” tools than can separate images into multiple tiles. 

You will have four different options for specifying how to separate (or dice) images. The first is indicating how many tiles to create in the X and Y direction. For example, I diced the  above image into four tiles in the X direction and three tiles in the Y direction, for a total of 12 tiles. 

Another option is to create tiles based on linear distance. In this case, the image must be georeferenced to a standard or RPC map projection and you must know the units associated with the projection. The following example shows an image georeferenced to a UTM Zone 13N WGS-84 projection, split into tiles that are 1000 x 1000 meters. 

In most cases the tiles in the last row and column will be smaller than the specified distance, as this example shows.

Another option is to dice an image by a given number of pixels in the X and Y direction. This is similar to the tile distance option.

Finally, you can create image tiles based on the spatial extent of vector records in a shapefile. Here is an example of how you might use this feature. Let’s say you have a Landsat scene and you want to separate it into tiles that correspond to USGS 7.5-minute topographic quadrangles. This screen capture shows a Landsat TM scene of the Grand Canyon along with a shapefile of Arizona quadrangle map boundaries (available from Data.gov).

Since there are so many polygons in this shapefile, I created a vector subset of only the records that overlap the Landsat image. Open the Attribute Viewer, then click in the display to select the records that you want to keep. The Attribute Viewer highlights the selected records.

Then choose the File > Save Selected Records to a new Shapefile menu option. Now we have a shapefile that only contains quadrangle map boundaries around the Landsat scene.


Now we’re ready to create the tiles. The Dice Raster tools are available from the Toolbox under Raster Management > Raster Dicer. Use the Dice Raster by Vector tool to separate the Landsat image into separate tiles based on the quadrangle boundaries.

Since the shapefile had 270 polygon records, the Dice Raster tool will create 270 separate images. Here is one of the resulting image tiles that corresponds to the House Rock Springs Quadrangle boundary, displayed with map grid line annotations (also available in ENVI 6.0):

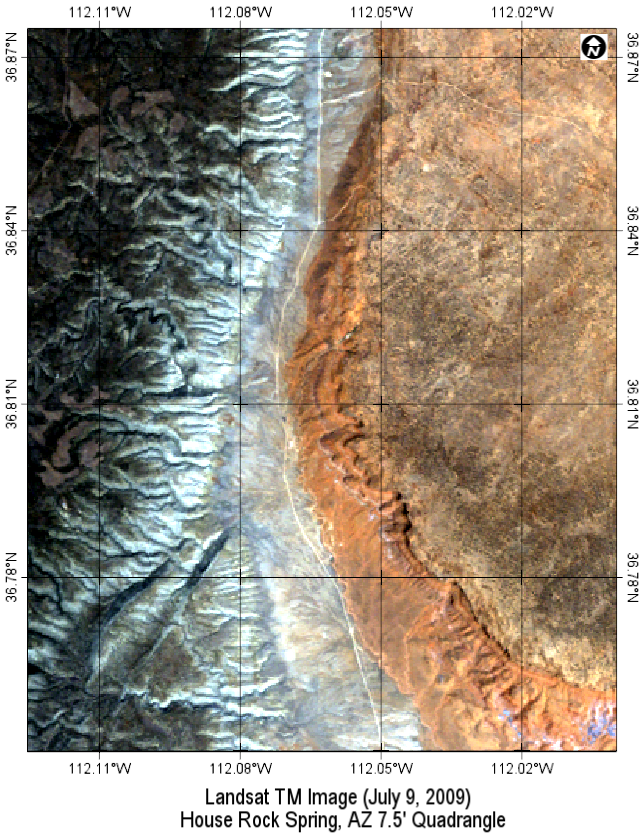
You can also use the Dice Raster tools, for example, to split an image of a large study area into smaller areas of analysis. They are just one of many versatile and easy-to-use features that will be available in the next release of ENVI.

1 comments on article "Creating Image Tiles in ENVI"

Avatar image

wishes choice

The website is lovingly serviced and saved as much as date. So it should be, thanks for sharing this with us i am also a blogger i am working on my site we have all types of wishes like anniversary,birthday and many more things check it now.

wisheschoice

http://wisheschoice.com/

Please login or register to post comments.