ENVI-powered Urban Heat Island GeoService Available on CloudEO
Rebecca Lasica
If you’ve spent much time in a large metropolitan area, you probably noticed that temperatures in the city tend to be higher than in surrounding areas. These temperature variations are known as urban heat islands (UHI). While these pockets of heat are a fact of life to city dwellers, they have wide ranging impacts on energy consumption, human health and safety. Wouldn’t it be nice if you could login to a website, select an area of interest, and gain insight in a specific UHI?
To be able to study UHIs, you would first need to obtain geospatial information, such as a time series of satellite imagery with thermal information, for your area of interest. Next, you’d likely require some set of specialized algorithms to process the data, not to mention a certain level of expertise to run the processes. What if we used our expertise and wrapped the data, the algorithms, and the processes together into an automated workflow, so all you would need to do is define an area and ask a question? Skipping to the punchline… that’s what we did!
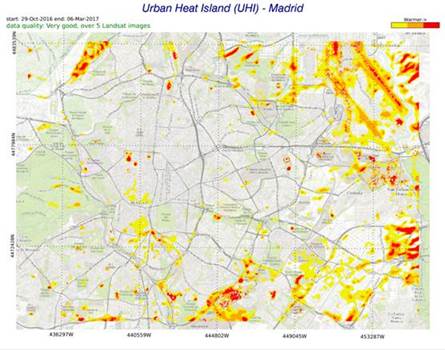
The first Harris-built GeoService exposed on the CloudEO store is the “Urban Heat Island” service. This service provides a historical analysis clearly identifying thermal peaks within urban areas. Users are able to intuitively select an urban area of interest and a date range. The GeoService reaches into the Landsat-8 archive and searches for at least 5 scenes within the date range having less than 20% cloud cover. With an 18-day revisit rate, it is easy to identify an optimal number of scenes to paint a picture (literally a heat map!) of temperature peaks that identify seasonal thermal variations. These variations, (UHIs), are used to assess heat loss/absorption from buildings, roads, and other manmade surfaces impacting localized weather within cities. These fluctuations affect air quality and urban climate which are essential for human health and welfare, urban planning, energy consumption, and environmental sustainability.
Without a need for time-consuming data searches and expensive on-site surveys, research organizations, real estate developers, construction and insurance companies can quickly get low-cost, relevant information pertaining to the extent of thermal anomalies within the selected urban areas. This information is used to evaluate urban development and to simplify energy needs and consumption models for urban areas.
CloudEO and NV5 Geospatial are working together to bring this and other ENVI-powered GeoServices directly to the market to help you solve some of your most challenging business problems. In addition, ENVI algorithms are directly exposed on CloudEO making the ENVI API more accessible than ever so you can develop your own GeoServices to run at-scale, or collaborate with us to develop the right solution for your business. To learn how to build your own GeoService, request the whitepaper: Building GeoServices for the CloudEO Store using ENVI®.
Be sure to watch our on-demand webinar demonstrating the Urban Heat Island GeoService and to learn more about developing and deploying your own solutions on CloudEO! Or try the Urban Heat Island GeoService for yourself here https://store.cloudeo-ag.com/urban-heat-islands.