X

NV5 Geospatial Blog

Each month, NV5 Geospatial posts new blog content across a variety of categories. Browse our latest posts below to learn about important geospatial information or use the search bar to find a specific topic or author. Stay informed of the latest blog posts, events, and technologies by joining our email list!


Mapping Earthquake Deformation in Taiwan With ENVI

Mapping Earthquake Deformation in Taiwan With ENVI

12/15/2025

Unlocking Critical Insights With ENVI® Tools Taiwan sits at the junction of major tectonic plates and regularly experiences powerful earthquakes. Understanding how the ground moves during these events is essential for disaster preparedness, public safety, and building community resilience. But traditional approaches like field... Read More >

Comparing Amplitude and Coherence Time Series With ICEYE US GTR Data and ENVI SARscape

Comparing Amplitude and Coherence Time Series With ICEYE US GTR Data and ENVI SARscape

12/3/2025

Large commercial SAR satellite constellations have opened a new era for persistent Earth monitoring, giving analysts the ability to move beyond simple two-image comparisons into robust time series analysis. By acquiring SAR data with near-identical geometry every 24 hours, Ground Track Repeat (GTR) missions minimize geometric decorrelation,... Read More >

Empowering D&I Analysts to Maximize the Value of SAR

Empowering D&I Analysts to Maximize the Value of SAR

12/1/2025

Defense and intelligence (D&I) analysts rely on high-resolution imagery with frequent revisit times to effectively monitor operational areas. While optical imagery is valuable, it faces limitations from cloud cover, smoke, and in some cases, infrequent revisit times. These challenges can hinder timely and accurate data collection and... Read More >

Easily Share Workflows With the Analytics Repository

Easily Share Workflows With the Analytics Repository

10/27/2025

With the recent release of ENVI® 6.2 and the Analytics Repository, it’s now easier than ever to create and share image processing workflows across your organization. With that in mind, we wrote this blog to: Introduce the Analytics Repository Describe how you can use ENVI’s interactive workflows to... Read More >

Deploy, Share, Repeat: AI Meets the Analytics Repository

Deploy, Share, Repeat: AI Meets the Analytics Repository

10/13/2025

The upcoming release of ENVI® Deep Learning 4.0 makes it easier than ever to import, deploy, and share AI models, including industry-standard ONNX models, using the integrated Analytics Repository. Whether you're building deep learning models in PyTorch, TensorFlow, or using ENVI’s native model creation tools, ENVI... Read More >

1345678910Last
23788 Rate this article:
3.0

Fostering Innovation - Support for VIIRS in ENVI

Anonym

People ask me why I like working at NV5 (formerly Exelis VIS), and I always have an easy answer: Our customers do inspiring work.

Scientists and researchers use ENVI and IDL to create innovative solutions to tough problems, so it's always great when we can provide new tools that help them get their jobs done. I'm especially excited about a new tool for Suomi National Polar-Orbiting Partnership (NPP) Visible-Infrared Imaging Radiometer (VIIRS) data that was recently added with the release of ENVI 5 Service Pack 3.

VIIRS is an advanced radiometer, combining the capabilities of two operational predecessor instruments, the Advanced Very High Resolution Radiometer (AVHRR) for optical imagery, and the Operational Line Scanner (OLS)on the Defense Meteorological Satellite System (DMSP) for day/night imagery. VIIRS will be used by the Earth observation community for a host of applications, including providing observations for input to weather and climate models, monitoring dust and aerosols in the atmosphere, monitoring weather systems, wildfires, floods, volcanic eruptions, and assessing impacts from extreme weather events. VIIRS data will contribute to the creation of over 20 specialized products used for monitoring the Earth's atmosphere, seas, and land surfaces.

NPP VIIRS
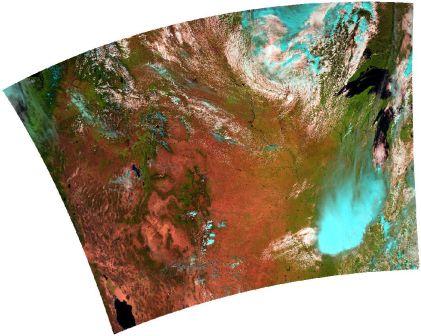
VIIRS RGB composite image over the USA. R=I3 (1610 nm), G=I2 (865 nm) & B=I1 (640 nm)

VIIRS imagery is stunning to display and explore in ENVI. This image (created in ENVI from a VIIRS image downloaded from NOAA CLASS) shows an RGB composite image projected into a geographic projection. VIIRS is an environmental sensor, and is particularly good at capturing land cover in high definition, as depicted in this image. One image collection contains an amazing level of detail over a huge portion of the Earth's surface.

ENVI is set up to read VIIRS data distributed through the NOAA CLASS system in HDF5 format, and makes it easy to ingest and display the complex data format. ENVI can work with both Sensor Data Records (SDRs) and Environmental Data Records (EDRs), and can read I-bands, M-bands and the amazing new Day/Night Band (DNB). In ENVI, it takes one step to do advanced processing like removing gaps and merging data granules, applying sensor calibrations (radiance or reflectance/thermal), and applying geocorrection and removing the bowtie deletion effect.

Please login or register to post comments.