Interactive Vector GUI
Anonym
With holidays rapidly approaching, I thought it might be nice to present a light hearted demonstration of capabilities; something that you can delight friends and family with during cold winter nights. This week’s post shows how to use a simple widget_window to create an interactive vector animation. The code is broken up into four pieces VectorBlog, VectorBlog_Event, VectorBlogMouseEvent, and VectorBlogVectorBuilder. The VectorBlog creates the widget itself and initially displays the vector information. VectorBlog_Event runs the events for the base widget. This is mainly the closing of the widget. VectorBlogMouseEvent is the mechanism by which the mouse locations are recoded by the widget window. Last but not least VectorBlogVectorBuilder builds the two matrices containing the horizontal and vertical components of the vector. When the following code is run the cursor location is recorded, a distance weighted vector diagram is created, and the resulting image is then displayed in the widget window. The only tricky bits in this code relate to the fact that there are two event handlers, one for the base widget and one for the mouse events in the widget window. The object reference for the image displayed must also be maintained and manipulated each time the cursor is move.
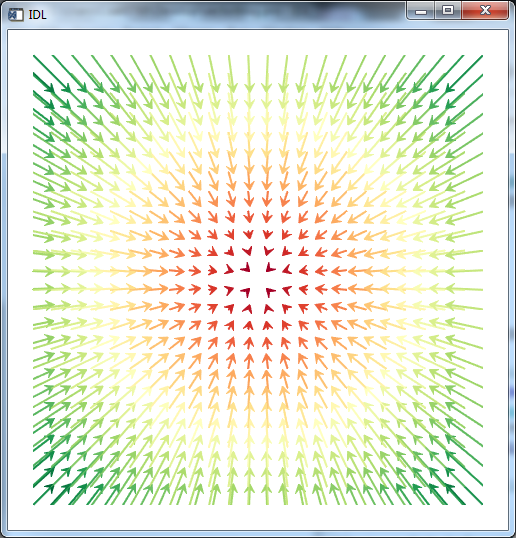
Figure 1: Example Vector Plot
;+
; Build the vecort components
; This is distance weighting
;-
pro VectorBlogVectorBuilder, dims = dims, pt = pt, u = u, v = v
  compile_opt IDL2

  ; Get all the x locations
  xs = findgen(dims[0])
  xs = xs#replicate(1,dims[1])

  ; Get all the y locations
  ys = findgen(dims[1])
  ys = transpose(ys# replicate(1,dims[0]))

  ; Build the horizontal components
  u = pt[0] - xs

  ; Build the vertical components
  v =  pt[1] - ys
end


;+
; The event handler called when the mouse is moved.
;-
FUNCTION VectorBlogMouseEvent, win, x, y, keymods
  COMPILE_OPT idl2

  ; Set the window
  win.SetCurrent

  ; Set the scale factor
  sc = .05

  ; Get the size of the window
  dims = win.DIMENSIONS * sc

  ; Get the vecotr information
  VectorBlogVectorBuilder, dims = dims, pt = [x*sc,y*sc], $
    u = u , v = v

  ; Build the vecotr image
  vector = vector(u,v,xrange=[0,dims[0]], yrange=[0,dims[1]], /current, AUTO_COLOR=1,  $
    RGB_TABLE=73, AXIS_STYLE = 0, LENGTH_SCALE=1.5, ARROW_THICK =3)

  ; Delete the old image
  win.uvalue.delete

  ; Display the new image
  win.uvalue = vector


END


;+
; The event handler for the widget
;-
pro VectorBlog_Event, ev
  compile_opt IDL2


end


pro VectorBlog
  compile_opt IDL2

  ; Setup the widget
  tlb = widget_base()
  wwindow = widget_window(tlb, MOUSE_MOTION_HANDLER='VectorBlogMouseEvent', $
    XSIZE=500, YSIZE=500)
  widget_control, tlb, /REALIZE

  ; Set the scale factor
  sc = .05

  ; Get infomation about the widget window
  WIDGET_CONTROL, wwindow, GET_VALUE=w
  dims = w.DIMENSIONS * sc

  ; Build the vecotr infomation
  VectorBlogVectorBuilder, dims = dims, pt = [(dims[0])/2.,(dims[1])/2.], $
    u = u , v = v

  ; Display the vectors
  vector = vector(u,v,xrange=[0,dims[0]], yrange=[0,dims[1]], /current, AUTO_COLOR=1,  $
    RGB_TABLE=73, AXIS_STYLE = 0, LENGTH_SCALE=1.5, ARROW_THICK =3)

  ; Record the vector object
  w.uvalue = vector
  WIDGET_CONTROL, tlb, SET_UVALUE=w

  ; Start the task manager
  XMANAGER, 'VectorBlog', tlb

end