Using ENVI and MODIS Imagery to Assess Drought Conditions
Anonym
Satellite remote sensing can help us monitor drought over large areas. In this article, I will show how I used ENVI to look at drought-related spectral indices for California in 2011 (normal precipitation year) and 2014 (drought year).
From late 2013 to present, California has faced a severe water shortage resulting from scarce precipitation and above-average temperatures. In Spring of 2014, the U.S. Drought Monitor showed that all of California was in the "Severe Drought" or higher category. Parts of California are still experiencing severe drought conditions to this day.
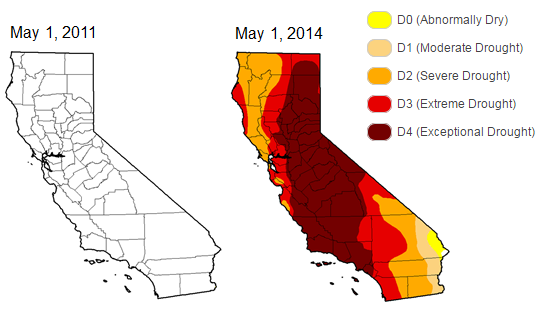
California drought severity maps, courtesy of the U.S. Drought Monitor (http://droughtmonitor.unl.edu)
We often think of drought as a period of abnormally low rainfall; however, it is more complex than that. Several environmental factors can lead to drought. When soil and vegetation give up water to the atmosphere (a process called evapotranspiration) while precipitation decreases over time, less moisture is available for vegetation uptake. In agricultural regions, this severely affects the livestock and people who depend on crops.
Because drought is associated with vegetation health, vegetation indices are often used to assess drought conditions. A commonly used index is the Normalized Difference Vegetation Index. NDVI is not a direct indicator of drought, but it can help reveal the spectral response of stressed vegetation resulting from low water intake.
NDVI remote sensing images are available on a regional to global scale. MODIS/Terra images are ideal because they provide a view of surface conditions over a large geographic area. At 500-meter spatial resolution, MODIS NDVI data can reveal patterns of vegetation health over county- or watershed-level extents.
I used the “Vegetation Indices 16-Day L3 Global 500” product (MOD13A1), which includes both NDVI and Enhanced Vegetation Index (EVI) images, averaged over 16-day periods. I downloaded a series of MOD13A1 image tiles that comprised most of California from the NASA Reverb/ECHO site, from April through June of 2011 (normal precipitation year) and 2014 (drought year).
I wrote a short batch script with the ENVI API that performed the following steps for each season of images:
- Extracted the NDVI band
- Reprojected the individual tiles from a sinusoidal projection to a Geographic WGS-84 projection
- Created a mosaic from the tiles
- Defined a spatial subset that included only the state of California and western Nevada
- Constructed a time series of these mosaics
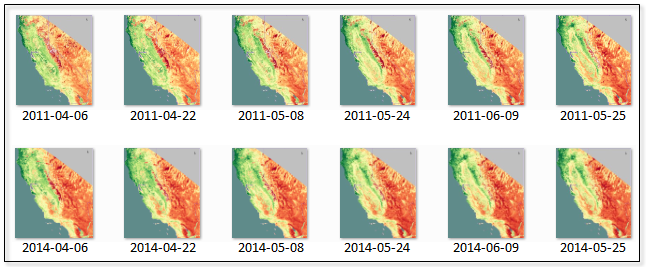
I displayed the NDVI images in ENVI and applied a color table to them. Here are some thumbnail images that show the seasonal time series for 2011 and 2014:
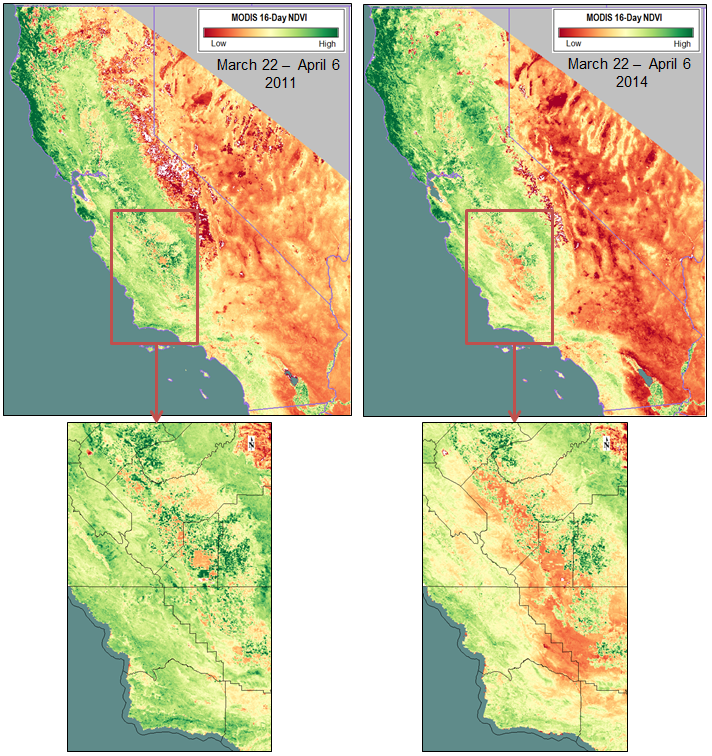
One of the most dramatic differences between 2011 and 2014 was in the southern part of the Central Valley in early spring:
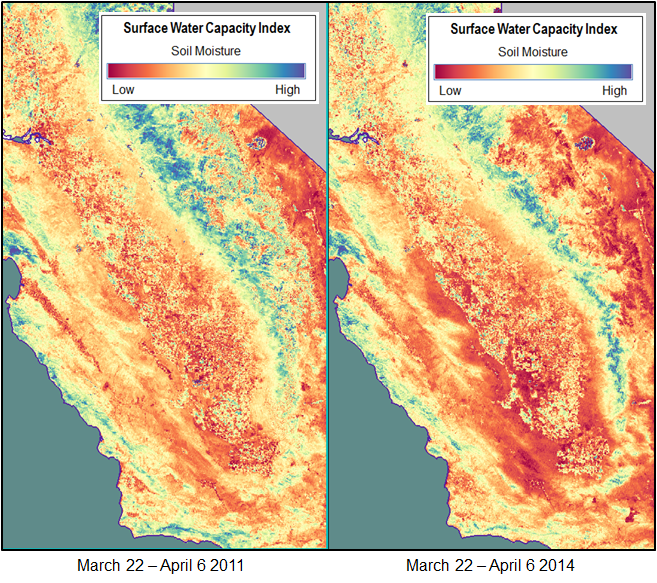
I also read a journal article by Zhang, et al. (2013) that compared drought-related spectral indices derived from MODIS surface reflectance data. One of these is the Surface Water Capacity Index (SWCI, Du et al., 2007), which highlights surface soil moisture. Using MODIS reflectance bands, the SWCI equation looks like this:
SWCI = (Band 6 - Band 7) / (Band 6 + Band 7)
I was curious to see how this would compare with the NDVI images. I wrote another batch script with the ENVI API that used band math with the MODIS reflectance data (MOD09A1) to derive a time series of SWCI images. After displaying the images and applying a color table in ENVI, I could see some differences in soil moisture between 2011 and 2014, including this example:
Studying drought with remote sensing is a complex endeavor, and this article only touched on the subject using spectral indices. We could take this a step further by constructing a vegetation condition index (VCI) that normalizes NDVI on a pixel-by-pixel basis over time. Another option is to construct a temperature condition index (TCI) that normalizes MODIS land surface temperature measurements over time. These are all simple tasks when using ENVI's API and image-analysis tools.
References:
Du, X., S. Wang, Y. Zhou, and H. Wei. “Construction and Validation of a New Model for Unified Surface Water Capacity Based on MODIS Data.” Geomatics and Information Science of Wuhan University 32, No. 3 (2007): 205-207.
Karnieli, A., N. Agam, R. Pinker, M. Anderson, M. Imhoff, G. Gutman, N. Panov, and A. Goldberg. “Use of NDVI and Land Surface Temperature for Drought Assessment: Merits and Limitations.” Journal of Climate 23 (2010): 618-632.
Mu, Q., F. Heinsch, M. Zhao, and S. Running. "Development of a Global Evapotranspiration Algorithm Based on MODIS and Global Meteorology Data." Remote Sensing of Environment 111 (2007): 519-536.
Zhang, N., H. Hong, Q. Qin, and L. Zhu. “Evaluation of the Visible and Shortwave Infrared Drought Index in China.” International Journal of Disaster Risk Science 4, No. 2 (2013): 68-76.
MODIS data are distributed by the Land Processes Distributed Active Archive Center (LPDAAC), located at USGS/EROS, Sioux Falls, SD. http://lpdaac.usgs.gov.