X

NV5 Geospatial Blog

Each month, NV5 Geospatial posts new blog content across a variety of categories. Browse our latest posts below to learn about important geospatial information or use the search bar to find a specific topic or author. Stay informed of the latest blog posts, events, and technologies by joining our email list!


Easily Share Workflows With the Analytics Repository

Easily Share Workflows With the Analytics Repository

10/27/2025

With the recent release of ENVI® 6.2 and the Analytics Repository, it’s now easier than ever to create and share image processing workflows across your organization. With that in mind, we wrote this blog to: Introduce the Analytics Repository Describe how you can use ENVI’s interactive workflows to... Read More >

Deploy, Share, Repeat: AI Meets the Analytics Repository

Deploy, Share, Repeat: AI Meets the Analytics Repository

10/13/2025

The upcoming release of ENVI® Deep Learning 4.0 makes it easier than ever to import, deploy, and share AI models, including industry-standard ONNX models, using the integrated Analytics Repository. Whether you're building deep learning models in PyTorch, TensorFlow, or using ENVI’s native model creation tools, ENVI... Read More >

Blazing a trail: SaraniaSat-led Team Shapes the Future of Space-Based Analytics

Blazing a trail: SaraniaSat-led Team Shapes the Future of Space-Based Analytics

10/13/2025

On July 24, 2025, a unique international partnership of SaraniaSat, NV5 Geospatial Software, BruhnBruhn Innovation (BBI), Netnod, and Hewlett Packard Enterprise (HPE) achieved something unprecedented: a true demonstration of cloud-native computing onboard the International Space Station (ISS) (Fig. 1). Figure 1. Hewlett... Read More >

NV5 at ESA’s Living Planet Symposium 2025

NV5 at ESA’s Living Planet Symposium 2025

9/16/2025

We recently presented three cutting-edge research posters at the ESA Living Planet Symposium 2025 in Vienna, showcasing how NV5 technology and the ENVI® Ecosystem support innovation across ocean monitoring, mineral exploration, and disaster management. Explore each topic below and access the full posters to learn... Read More >

Monitor, Measure & Mitigate: Integrated Solutions for Geohazard Risk

Monitor, Measure & Mitigate: Integrated Solutions for Geohazard Risk

9/8/2025

Geohazards such as slope instability, erosion, settlement, or seepage pose ongoing risks to critical infrastructure. Roads, railways, pipelines, and utility corridors are especially vulnerable to these natural and human-influenced processes, which can evolve silently until sudden failure occurs. Traditional ground surveys provide only periodic... Read More >

1345678910Last
«November 2025»
SunMonTueWedThuFriSat
2627282930311
2345678
9101112131415
16171819202122
23242526272829
30123456
18147 Rate this article:
No rating

Using Reports in a Cloud Based Environment

Anonym

One hurdle that I often find challenging when working in the cloud, is the question "Where is the data?" This question is not just for inputs and the processing chain, but also the output data and how a person can (and should) access it.

When in a server environment, it is not common that a person who is accessing that server will want to do processing, and then download the full final files for inspection due to their size. Instead, it's much simpler to generate a smaller file that retains the information necessary. This way, the smaller file can be downloaded, or even just viewed on the server with a web client.

This was our motivation in the Custom Services Group while constructing the report generator for the Precision AG Toolkit. This system takes in parameters in XML format as key value pairs (ie stretch="2% linear", or color_table="39") and with these parameters, the reports from the tool are not only highly customizable, but also easy to change or generate new ones.

Once results are generated from the server, the image is placed in to a document (it currently only supports PDF) and the extra graphics are added in. This can be objects like text, colorbars, and scaling. Below is an example of this that we generated using the Precision AG Toolkit's Hotspot Analysis Tool, and a template made specifically for reporting these hotspots.

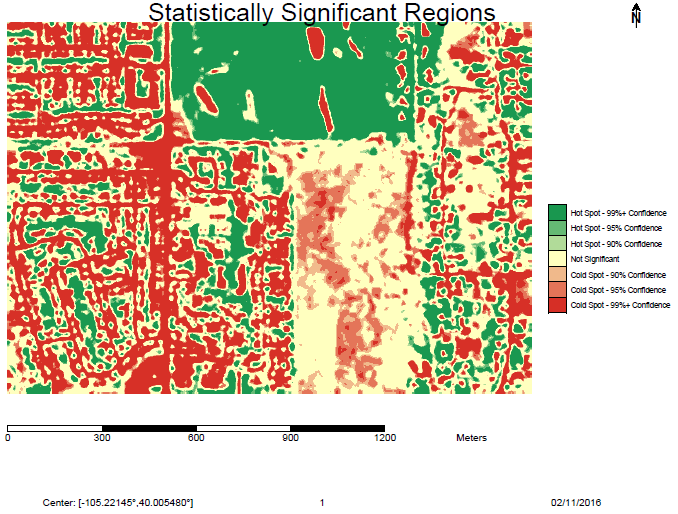
The Hotspot Analysis tool uses a scoring system to determine the most important "Hotspots" in a image that is generated from a vegetation index. In this case we used NDVI for plant health. The large green region at the top of the image is a golf course.

This portable format is viewable very quickly, since the document will be a fraction of the actual file size. Because of this, reporting is going to be much faster than traditional methods including downloading and analyzing the data. It's also an extra perk that the files are small enough to send in an e-mail! (Imagine that....)

Total size of the above example? 57 KB.

Please login or register to post comments.