Why LiDAR?
Anonym
Next week, the International LiDAR Mapping Forum (ILMF) will be taking place in Denver, Colorado. ILMF is a three-day technical conference and exhibition focused on airborne, terrestrial, and bathymetric LiDAR. While all conferences are exciting, I am particularly pumped for this one because new developments in LiDAR technologies seem to be happening at an astoundingly rapid rate. Advancements in what can be done with LiDAR are being driven by the increasing availability of data from a variety of sources. NOAA’s Digital Coast data center and NSF OpenTopography are just a couple of my favorite places to access freely-available datasets that have been collected from a number of different sources. What’s exciting about where we are with LiDAR technology is that while the richness of the data has long been understood, the ability of software applications to extract useful information wasn't always what it is today. And the future is looking even brighter. The ability of software applications to extract useful data that can be applied to real-world situations seems to be increasing at an exponential rate. This information is beginning to play a larger role in many sectors, including coastal zone mapping, disaster response, utility asset management, precision agriculture, oil and gas operations, and numerous GIS applications.
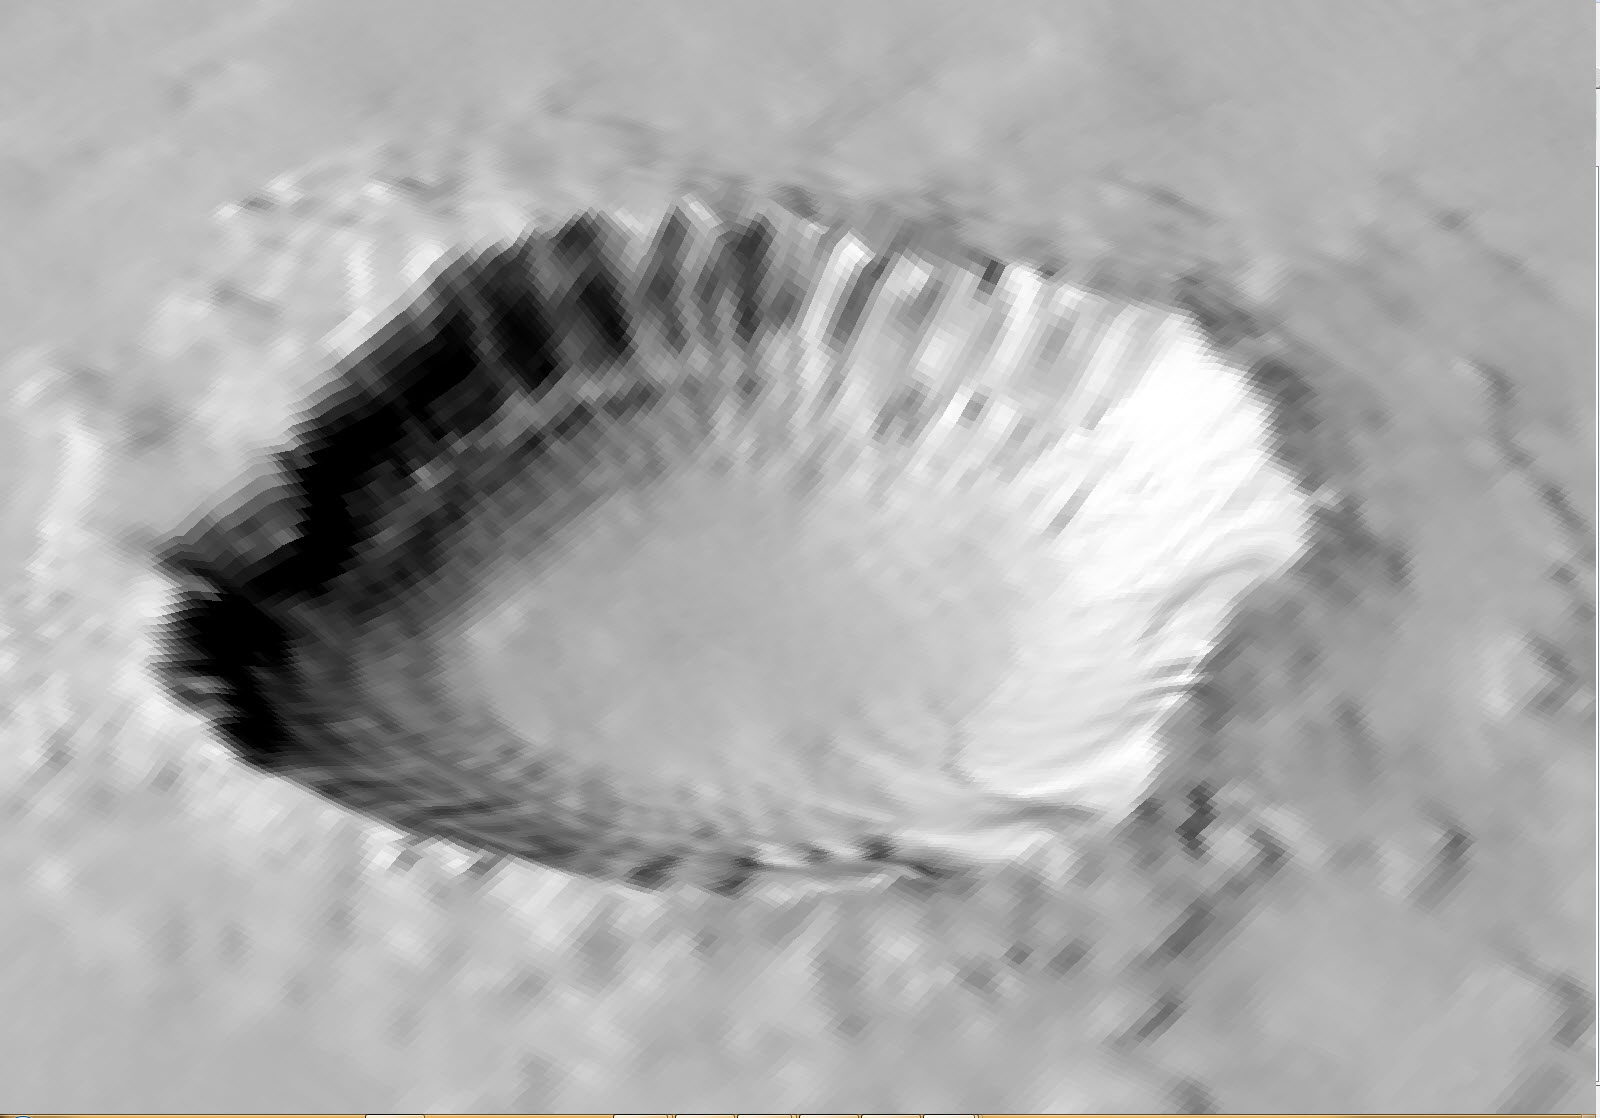
To me, understanding why the use of LiDAR is spreading so rapidly is as simple as comparing the information that can be extracted from LiDAR to other, more traditional, forms of data that LiDAR is quickly replacing. Let’s take the simple example of a Digital Elevation Model (DEM). Anyone who has ever taken an introductory GIS course has likely worked with a DEM from the National Elevation Dataset (NED) produced by the United States Geological Survey (USGS). NED data are available nationally (except for Alaska) at resolutions of approximately 10 meters and 30 meters. If you’re lucky, you might be working in one of the limited areas in which DEMs are available at approximately 3-meter resolution, but I personally have never been so lucky. Data sources for the NED 10-meter and 30-meter resolution DEMs are typically a combination of cartographic contours, mapped hydrography and stereo-pair photography. Here’s what a hill shade of Meteor Crater in Arizona created from a 10-meter resolution USGS DEM looks like as visualized using the 3D Viewer in ENVI.
Now, let's contrast that with a hill shade created from a DEM generated using high-resolution point-cloud LiDAR data. The hill shade of Meteor Crater pictured below was created using a 0.5-meter resolution DEM that was in turn generated from point-cloud LiDAR data downloaded freely from NSF OpenTopography.
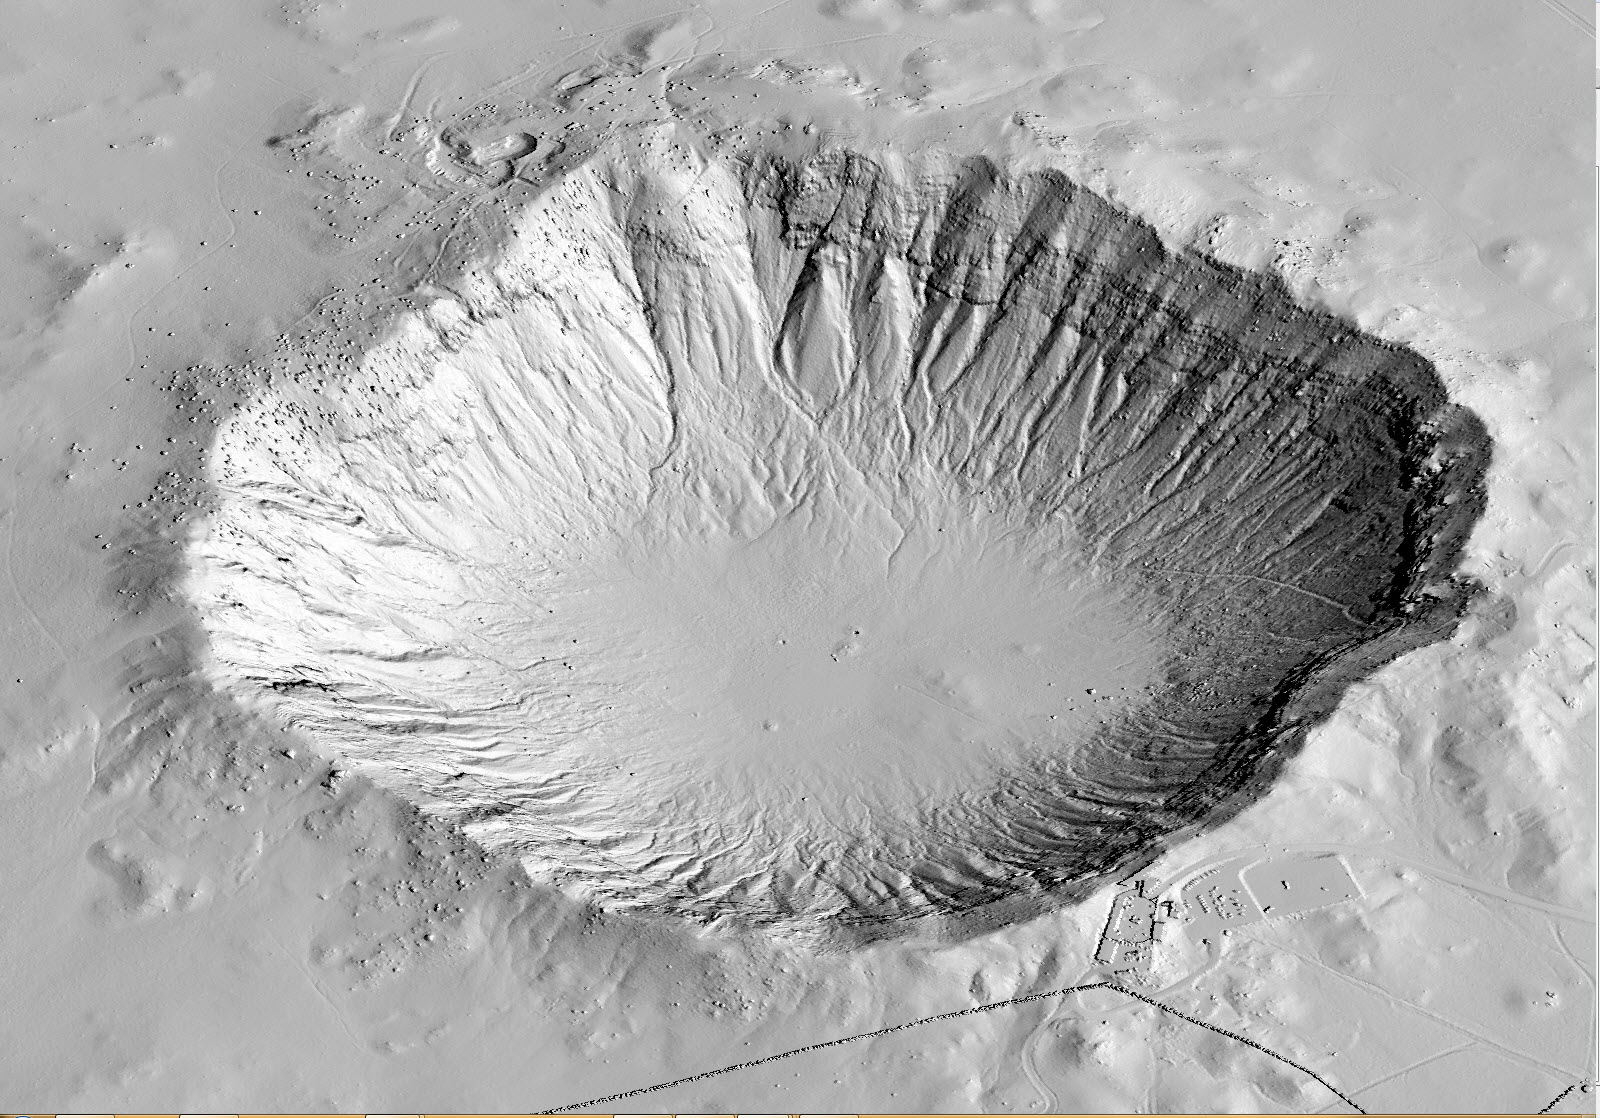
Notice a difference? This is just one example of how LiDAR data is beginning to change the way we are able to view and analyze our world. More accurate DEMs can provide better results when performing slope analysis, generating viewshed information, and determining the amount of erosion and deposition that has occurred when comparing multi-temporal datasets. And this is just the tip of the iceberg. LiDAR offers the ability to extract far more information than just elevation data and the results are typically very accurate. Increased accuracy leads to better results, which in turn leads to better decision-making and reduced costs for you, your employer, your university and/or your government.