Performing Flood Mapping After Cyclone Yaas Using ENVI SARscape
In May 2021, Cyclone Yaas hit the east coast of India with wind gusts up to 140 kilometers per hour (87 mph). It strengthened to the equivalent of a Category 1 Atlantic hurricane on May 23 and made landfall at Baleshwar on May 25 at peak intensity. The storm produced damaging storm surges, which caused flooding and left tens of thousands of people homeless.
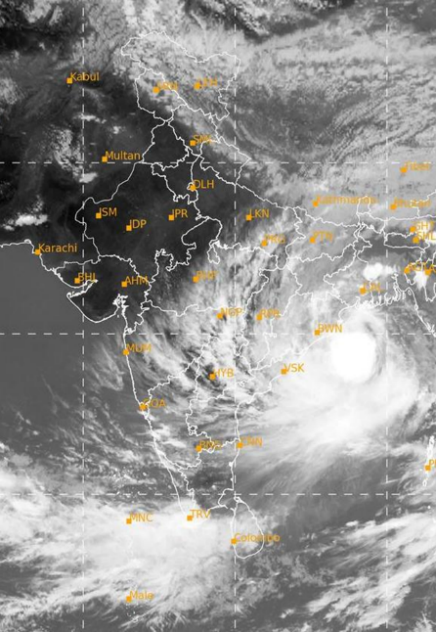
Cyclone Yaas image captured May 23rd (IMD)
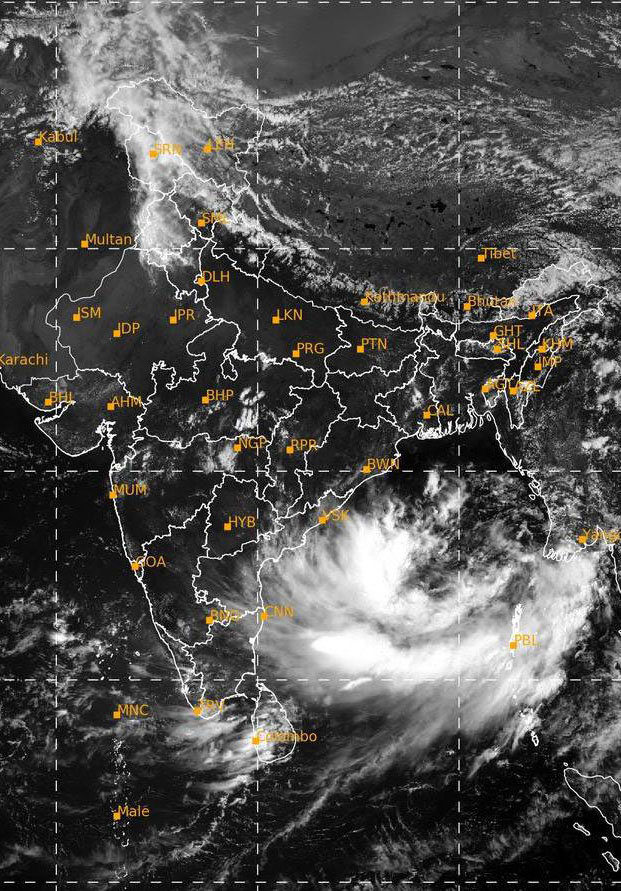
Cyclone Yaas image captured May 25th (IMD)
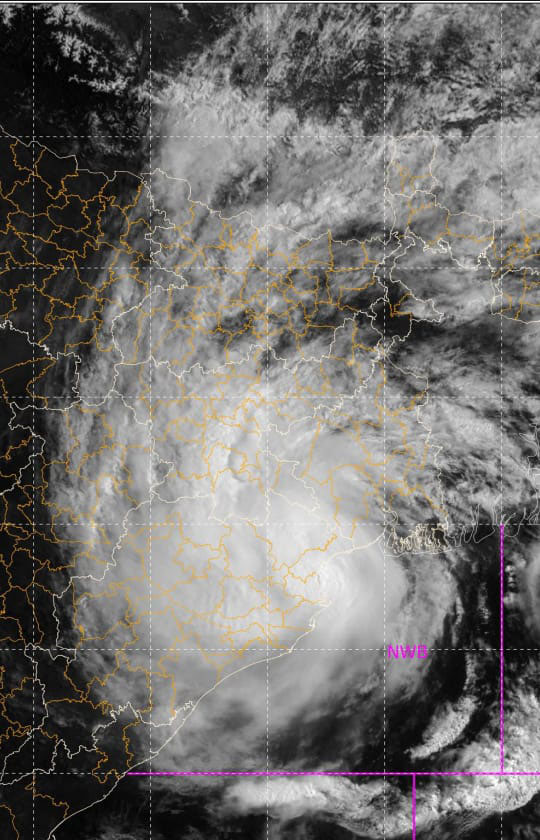
Cyclone Yaas image captured May 26th (IMD)
Synthetic Aperture Radar (SAR) data is particularly useful during weather emergencies like cyclones and hurricanes because it can see through cloud cover that often hampers other sensors’ abilities to capture the situation on the ground. After SAR data is captured, it must be processed and analyzed.
The following flood analysis from Cyclone Yaas was performed using ENVI® SARscape® by our exclusive Indian distributor, Esri India. ENVI SARscape is the leading SAR processing and analysis software on the market and is used worldwide to extract actionable information from SAR data. To perform the analysis, Sentinel-1 data captured before and after the cyclone (May 17 and May 29) and ENVI SARscape was used to create a SAR composite image. Next, the flooded area was extracted, and a change detection analysis was performed. Below are more details on these steps.
SAR Composite Image Creation
The first step in this analysis was to create the SAR composite image using ENVI SARscape. This required pre-processing the images both before and after the cyclone. To improve their quality, a spatial filter was applied to reduce the speckled appearance in the datasets.
The next step was to perform geometric and radiometric calibration on the filtered intensity images. Geometric and radiometric calibration of the backscatter values are necessary to accurately compare radar images acquired with different sensors, and to correct for terrain and sensor affects. A DEM is necessary for the geometric calibration (geocoding) of the imagery. For the next step, a color composite image was created from different polarizations to help visually distinguish between different surface features such as mountains, cities, and water bodies. The color composite of the geocoded dataset used the following polarization combinations: VV (Red), VH (Green), and VV/VH ratio (Blue). This process was applied to images both before and after the flood.
Purba Medinipur after cyclone SAR VH, VV and VV/VH composite image
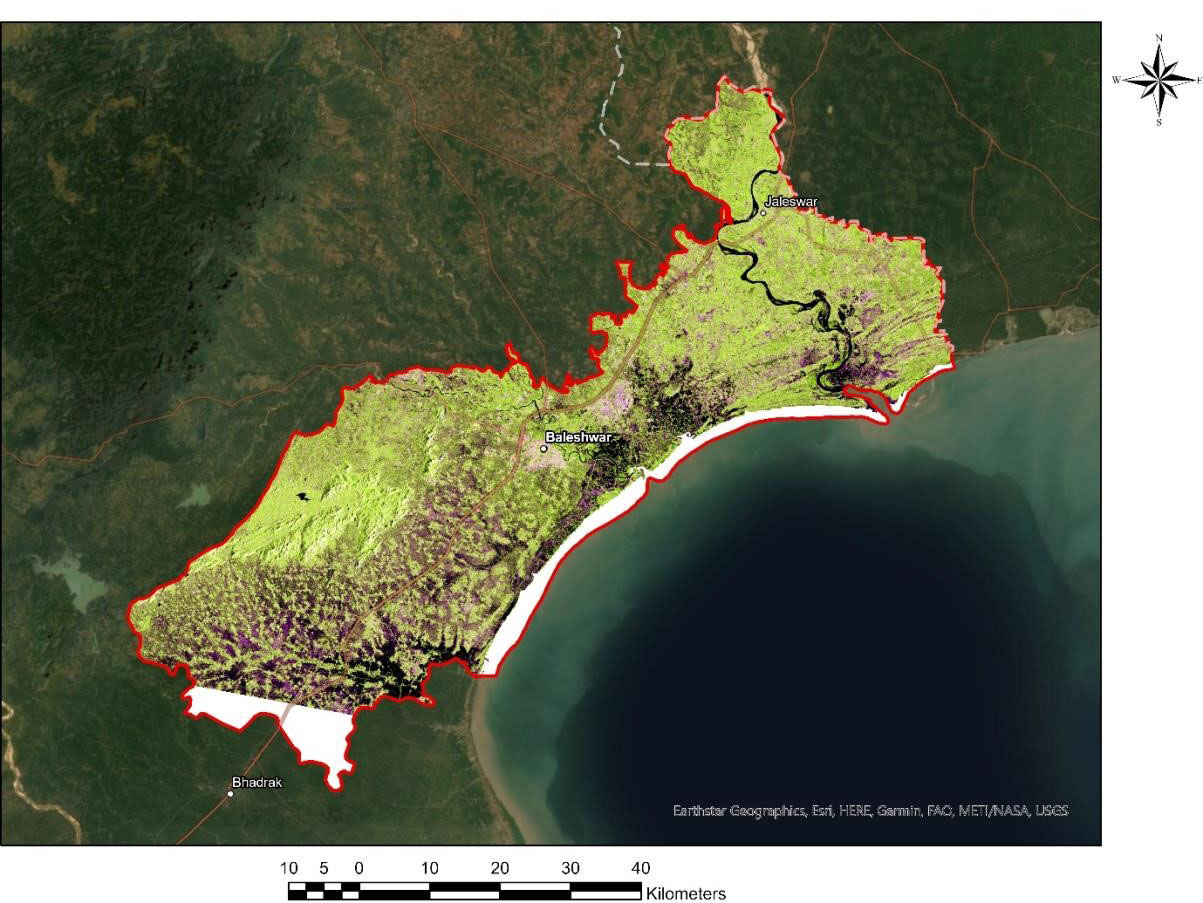
Baleshwar after cyclone VH image
Extraction of Flooded Areas Using ENVI SARscape Analytics
ENVI SARscape Analytics has an automatic workflow that makes it easy to extract flooded areas. The inputs required for the analysis are pre- and post-SAR images of the same area that have been pre-processed in ENVI SARscape. Using the DEM, the processing will deliver layers in the target folder including the flooded layers. For this analysis, there was some refinement performed to improve the identification of the flooded area.
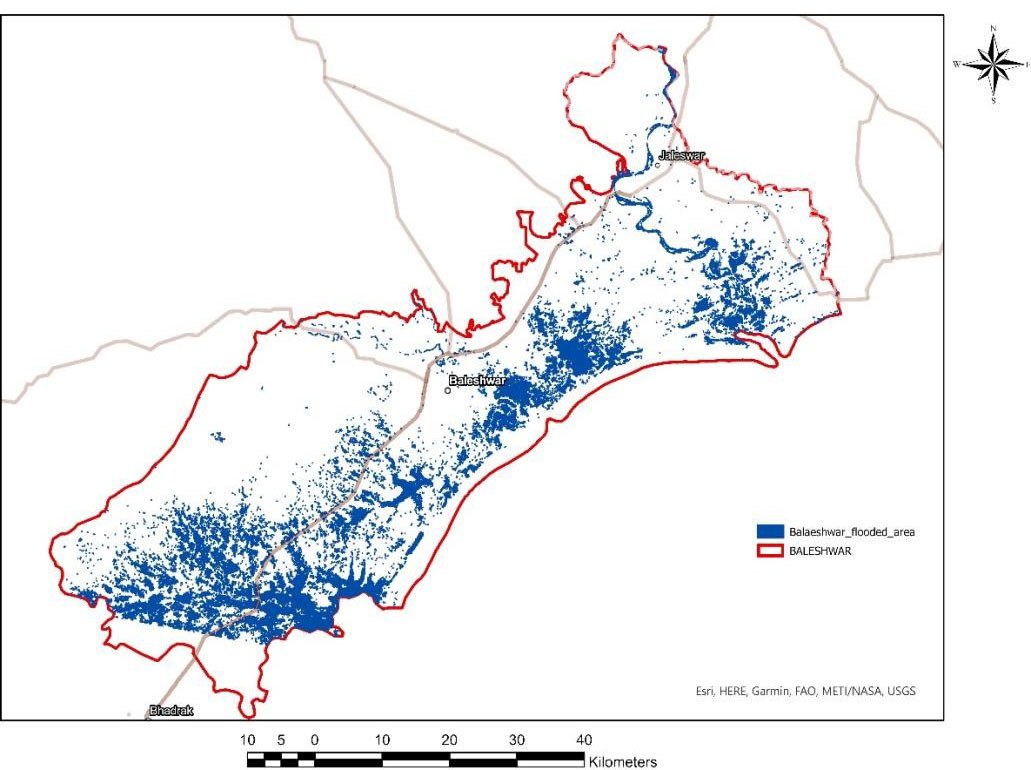
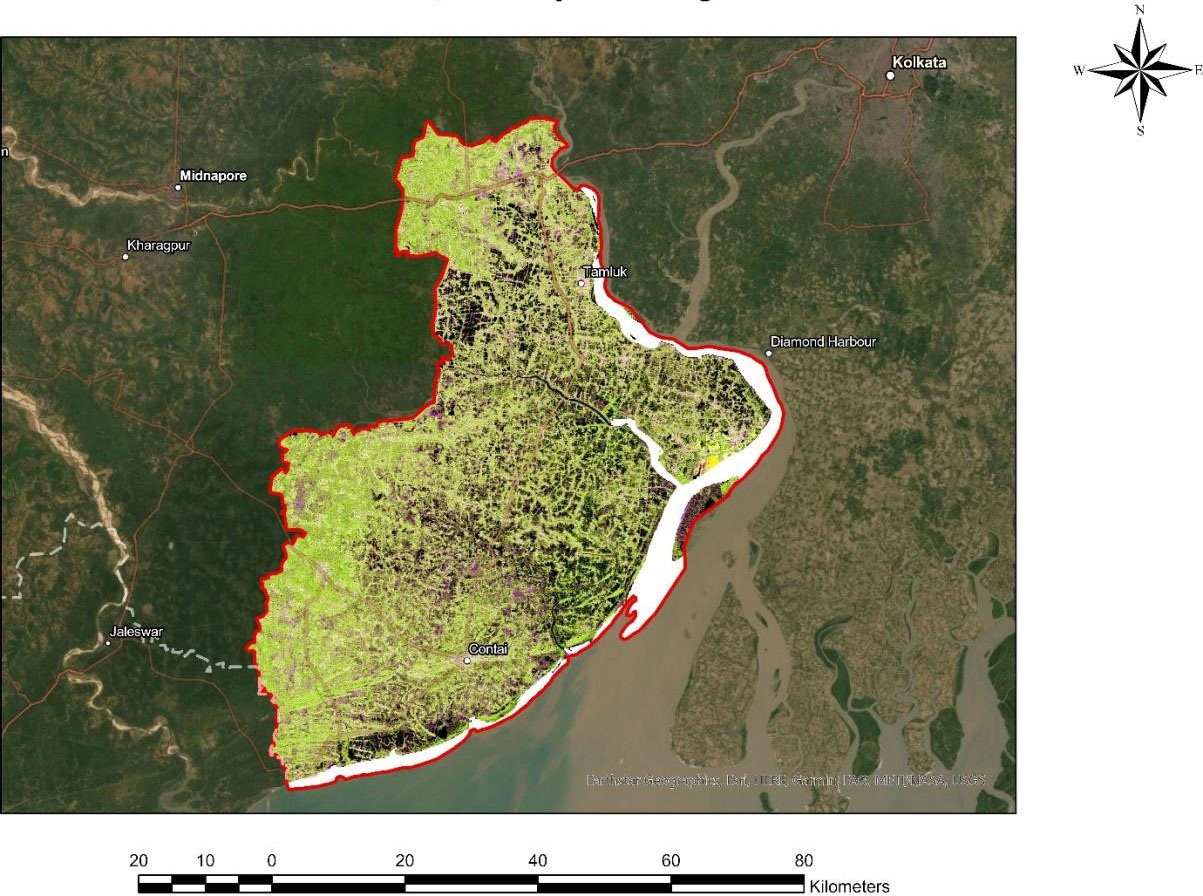
Baleshwar after cyclone flooded area
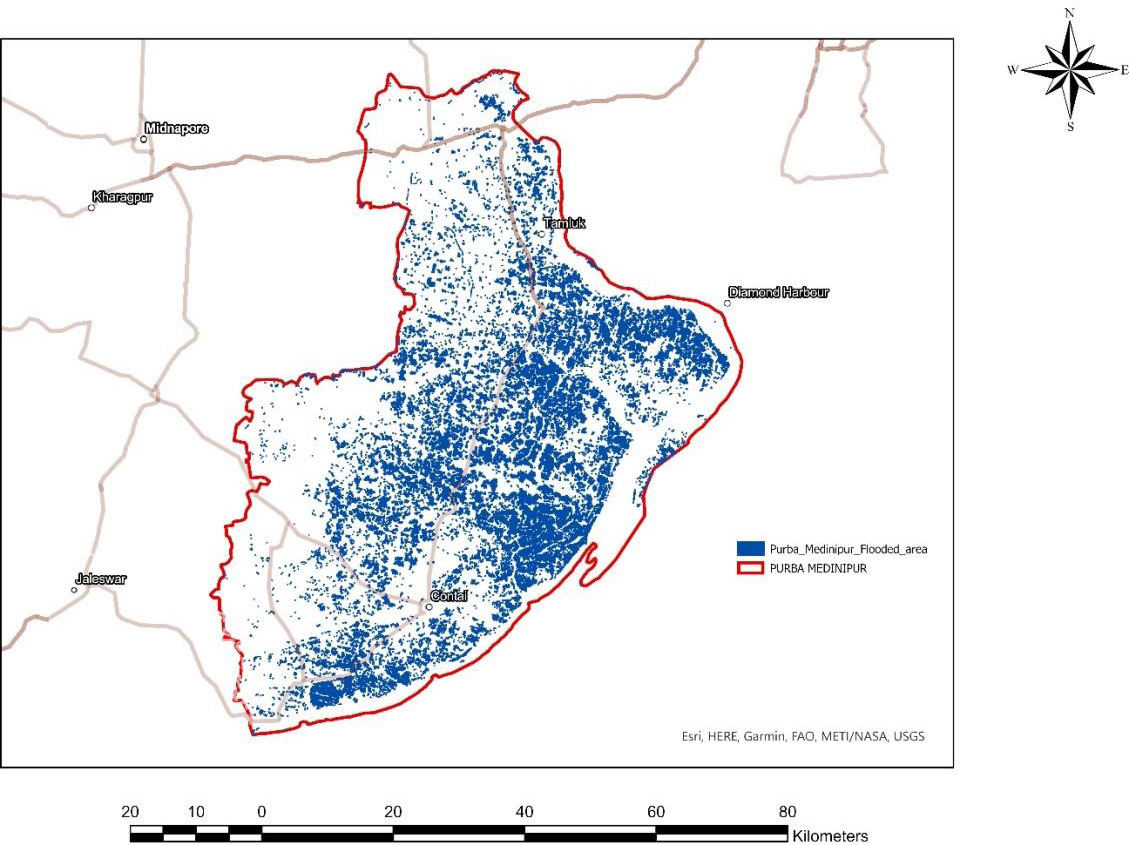
Purba Medinipur after cyclone flooded area
Performing Change Detection with ENVI SARscape Analytics
To perform change detection analysis, SAR images are needed from before and after the event. This type of time series analysis shows what has changed in the area of interest over a set amount time. In this example, the time series analysis occurs from prior to the cyclone and after it made landfall.
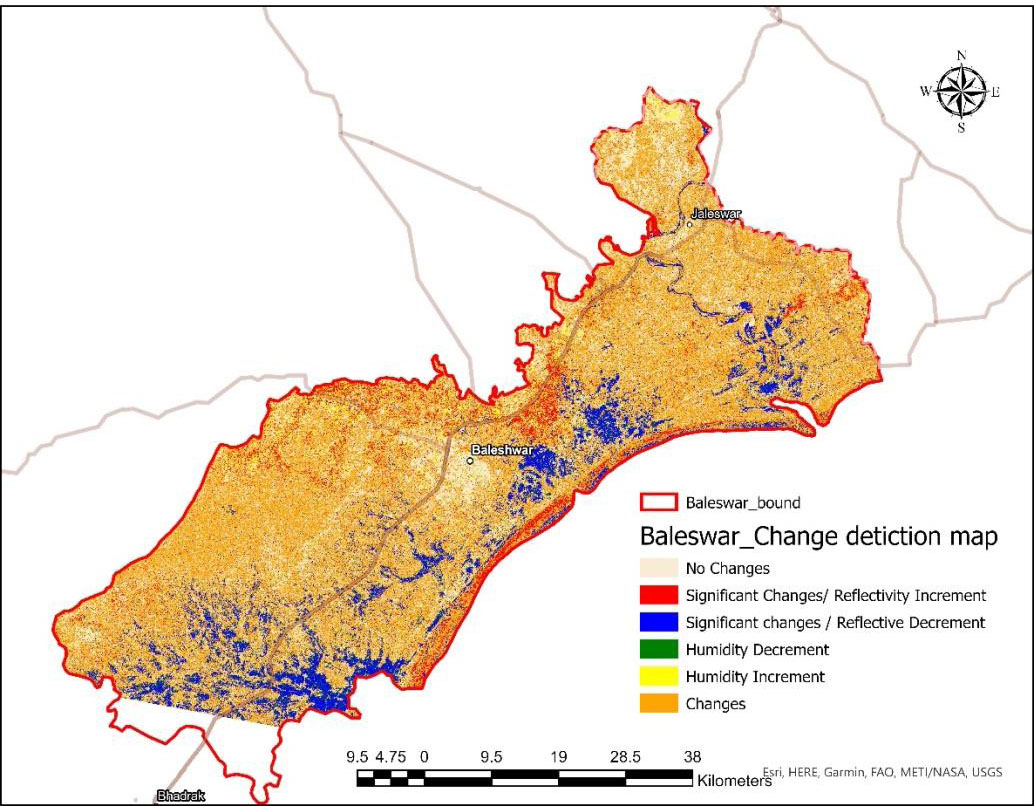
Baleshwar change map after YAAS cyclone
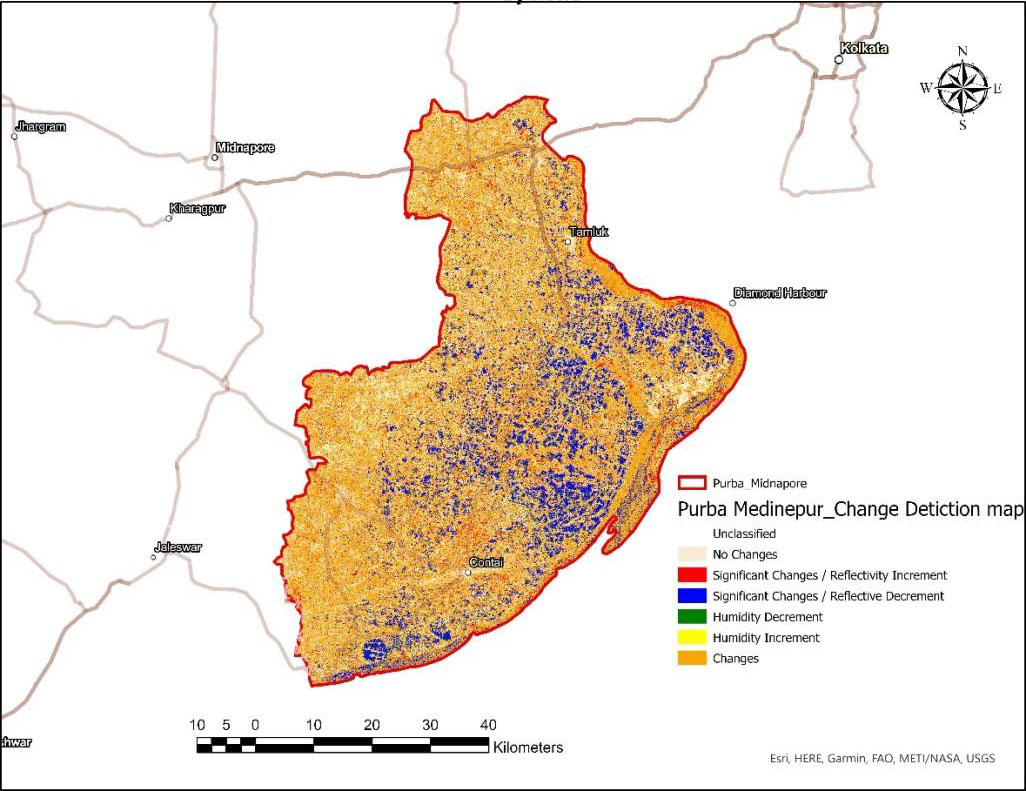
Purba Medinipur change map after cyclone
Nowadays, flooding events are occurring more frequently, so the ability to detect changes, monitor flood frequency, and isolate the high probability flood locations has become critical. Using SAR data and ENVI SARscape for this type of analysis will ensure accurate and timely results.
For the full example and how results can be viewed in ArcGIS Pro, please see this post by Esri India, showing the condition of Baleshwar and Purba Medinipur after the cyclone.