Geospatial Solutions in the Cloud
What are Geospatial Analytics?
Geospatial analytics allow people to ask questions of data that exist within a spatial context. Usually this means extracting information from remotely sensed data such as multispectral imagery or LiDAR that is focused on observing the Earth and the things happening on it, both in a static sense or over a period of time. Familiar examples of this type of geospatial analysis include Land Classification, Change Detection, Soil and Vegetative indexes, and depending on the bands of your data, Target Detection and Material Identification. However, geospatial analytics can also mean analyzing data that is not optical in nature.
So what other types of problems can geospatial analytics solve? Geospatial analytics comprise of more than just images laid over a representation of the Earth. Geospatial analytics can ask questions of ANY type of geospatial data, and provide insight into static and changing conditions within a multi-dimensional space. Things like aircraft vectors in space and time, wind speeds, or ocean currents can be introduced into geospatial algorithms to provide more context to a problem and to enable new correlations to be made between variables.
Many times, advanced analytics like these can benefit from the power of cloud, or server-based computing. Benefits from the implementation of cloud-based geospatial analytics include the ability to serve on-demand analytic requests from connected devices, run complex algorithms on large datasets, or perform continuous analysis on a series of changing variables. Cloud analytics also improve the ability to conduct multi-modal analysis, or processes that take into account many different types of geospatial information.
Here we can see vectors of a UAV along with the ground footprint of the sensor overlaid in Google Earth™, as well as a custom interface built on ENVI that allows users to visualize real-time weather data in four dimensions (Figure-1).
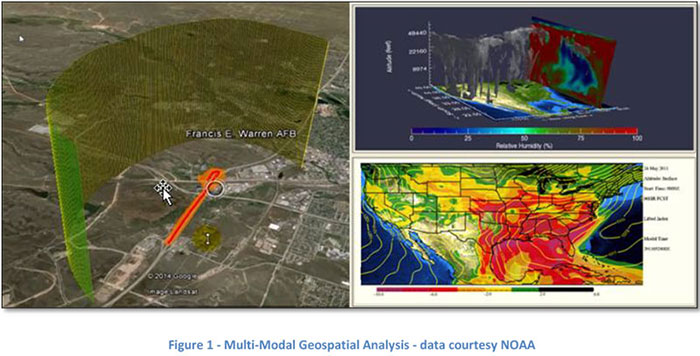
These are just a few examples of non-traditional geospatial analytics that cloud-based architecture is very good at solving.
Cloud-Based Geospatial Analysis Models
So let’s take a quick look at how cloud-based analytics work. There are two different operational models for running analytics, the on-demand model and the batch process model. In a on-demand model (Figure 2), a user generally requests a specific piece of information from a web-enabled device such as a computer, a tablet, or a smart phone. Here the user is making the request to a cloud based resource.
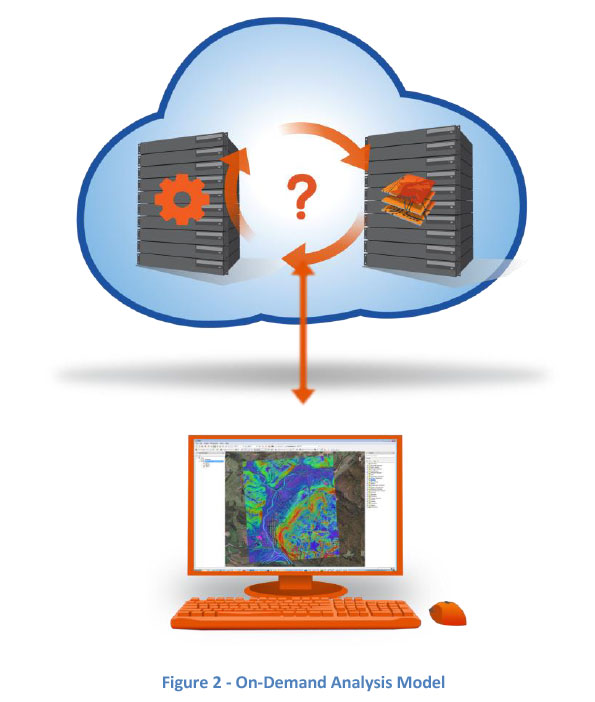
Next, the server identifies the requested data and runs the selected analysis on it. This leverages scalable server architecture that can vastly decrease the amount of time it takes to run the analysis and eliminate the need to host the data or the software on the web-enabled device. Finally, the requested information is sent back to the user, usually at a fraction of the bandwidth cost required to move large amounts of data or full resolution derived products through the internet.
In the automated batch process analysis model (Figure 3), the cloud is designed to conduct prescribed analysis to data as it becomes available to the system, reducing the amount of manual interaction and time that it takes to prepare or analyze data. This system can take in huge volumes of data from various sources such as aerial or satellite images, vector data, full motion video, radar, or other data types, and then run a set of pre-determined analyses on that data depending on the data type and the requested information .
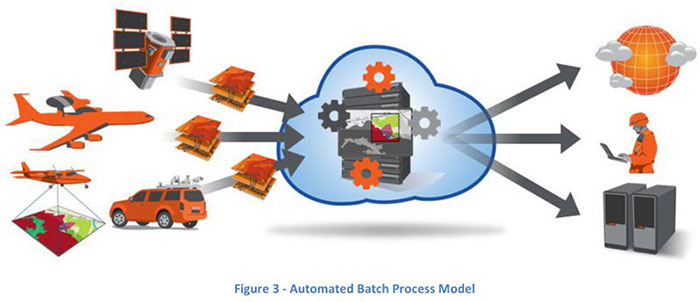
Once the data has been pre-processed, it is ready for consumption, and the information is pushed out to either another cloud based asset, such as an individual user that needs to request information or monitor assets in real-time, or simply placed into a database in a ‘ready-state’ to be accessed and analyzed later.
The ability for this type of system to leverage the computing power of scalable server stacks enables the processing of huge amounts of data and greatly reduces the time and resources needed to get raw data into a consumable state.
Solutions in the Cloud
|
HySpeed Computing
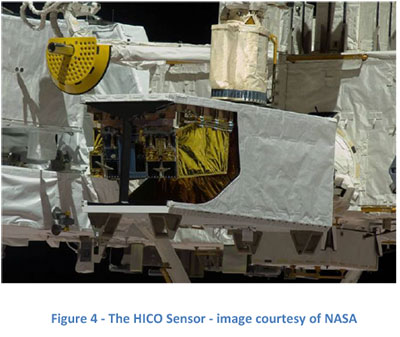
Now let's take a look at a couple of use cases that employ ENVI capabilities in the cloud. The first is a web-based interface that allows users to perform on-demand geospatial analytics on hyperspectral data supplied by HICO™, the Hyperspectral Imager for the Coastal Ocean (Figure 4). HICO is a hyperspectral imaging spectrometer that is attached to the International Space Station (ISS) and is designed specifically for sampling the coastal ocean in an effort to further our understanding of the world's coastal regions.
|
 |
Developed by HySpeed Computing, the prototype HICO Image Processing System (Figure 5) allows users to conduct on-demand image analysis of HICO's imagery from a web-based browser through the use of ENVI cloud capabilities.
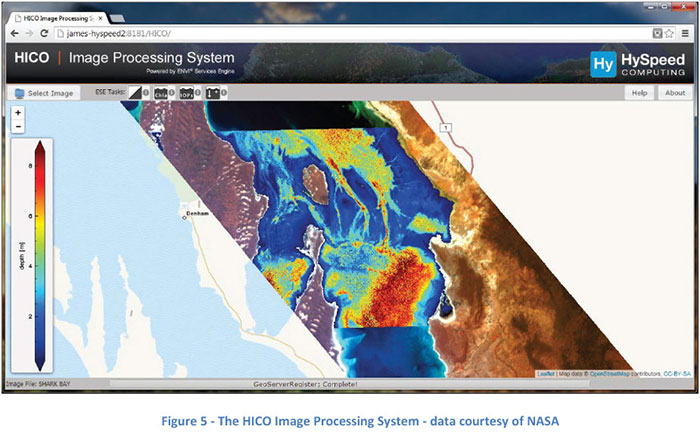
The interface exposes several custom ENVI tasks designed specifically to take advantage of the unique spectral resolution of the HICO sensor to extract information characterizing the coastal environment. This type of interface is a good example of the on-demand scenario presented earlier, as it allows users to conduct on-demand analysis in the cloud without the need to have direct access to the data or the computing power to run the hyperspectral algorithms.
The goal of this system is to provide ubiquitous access to the robust HICO catalog of hyperspectral data as well as the ENVI algorithms needed to analyze them. This will allow researchers and other analysts the ability to conduct valuable coastal research using web-based interfaces while capitalizing on the efforts of the Office of Naval Research, NASA, and Oregon State University that went into the development, deployment, and operation of HICO.
Milcord
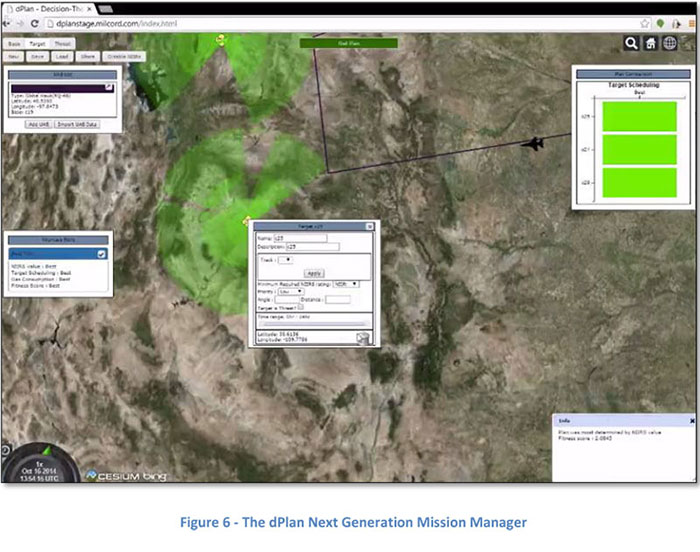
Another use case involves a real-time analysis scenario that comes from a company called Milcord and their dPlan Next Generation Mission Manager (Figure 6). The goal of dPlan is to "aid mission managers by employing an intelligent, real-time decision engine for multi-vehicle operations and re-planning tasks"1. What this means is that dPlan helps folks make UAV flight plans based upon a number of different dynamic factors, and delivers the best plan for multiple assets both before and during the actual operation.
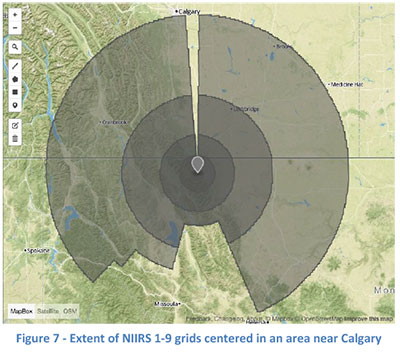
Factors that are used to help score the flight plans include fuel availability, schedule metrics based upon priorities for each target, as well as what are known as National Image Interpretability Rating Scales, or NIIRS (Figure 7). NIIRS are used "to define and measure the quality of images and performance of imaging systems. Through a process referred to as "rating" an image, the NIIRS is used by imagery analysts to assign a number which indicates the interpretability of a given image."2
|
These factors are combined into a cost function, and dPlan uses the cost function to find the optimal flight plan for multiple assets over a multitude of targets. dPlan also performs a cost-benefit analysis to indicate if the asset cannot reach all targets, and which target might be the lowest cost to remove from the plan, or whether another asset can visit the target instead.
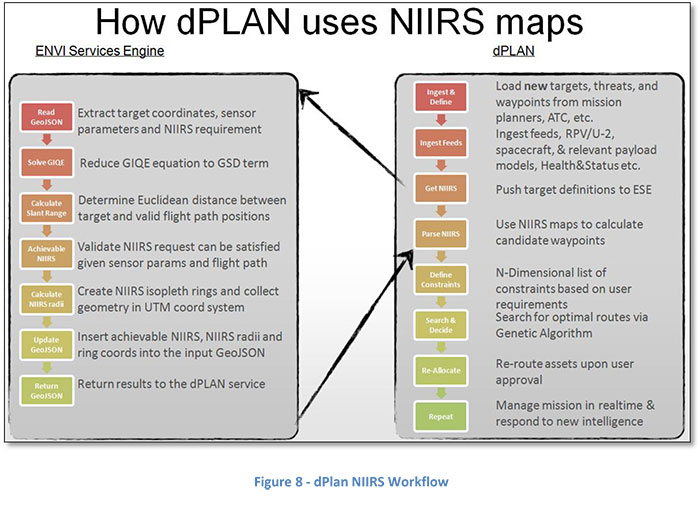
dPlan employs a custom ESE application to generate huge grids of Line of Sight values and NIIRs values associated with a given asset and target (Figure 8). dPlan uses this grid of points to generate route geometry, for example, how close and at what angle does the asset need to approach the target.
|
 |
The cloud-computing power leveraged by dPlan allows users to re-evaluate flight plans on the fly, taking into account new information as it becomes available in real time. dPlan is a great example of how cloud-based computing combined with powerful analysis algorithms can solve complex problems in real time and reduce the resources needed to make accurate decisions amidst changing environments.
Solutions in the Cloud
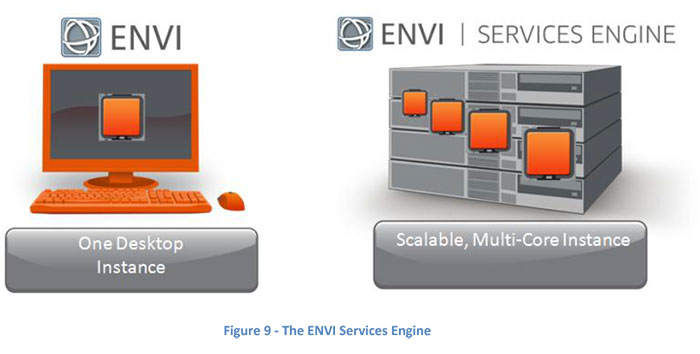
So what do we do here at NV5 Geospatial to enable folks like HySpeed Computing and Milcord to ask these kinds of questions from their data and retrieve reliable answers? The technology they're using is called the ENVI Services Engine (Figure 9), an enterprise-ready version of the ENVI image analytics stack. We currently have over 60 out-of-the-box analysis tasks built into it, and are creating more with every release.
The real value here is that ENVI Services Engine allows users to develop their own analysis tasks and expose them through the engine. This is what enables users to develop unique solutions to geospatial problems and share them as repeatable processes for others to use. These solutions can be run over and over again on different data and provide consistent dependable information to the persons requesting the analysis. The cloud based technology makes it easy to access from web-enabled devices while leveraging the enormous computing power of scalable server instances. This combination of customizable geospatial analysis tasks and virtually limitless computing power begins to address some of the limiting factors of analyzing what is known as big data, or datasets so large and complex that traditional computing practices are not sufficient to identify correlations within disconnected data streams.
Our goal here at NV5 Geospatial is to enable you to develop custom solutions to industry-specific geospatial problems using interoperable, off-the-shelf technology. For more information on what we can do for you and your organization, please feel free to contact us.
Sources:
- 2014. Milcord. "Geospatial Analytics in the Cloud: Successful Application Scenarios" webinar.
https://event.webcasts.com/starthere.jsp?ei=1042556
- 2014. The Federation of American Scientists. "National Image Interpretability Rating Scales".
http://fas.org/irp/imint/niirs.htm