Vegetation Analysis: Using Vegetation Indices in ENVI
Introduction
The ability to measure electromagnetic energy at varying wavelengths as it interacts with a material forms some of the foundation behind remote sensing and spectral science. The physical characteristics of the material cause the electromagnetic energy to be reflected, refracted, or absorbed in a way that is unique to each material. These interactions are measured across discrete sections of the spectrum, that when plotted, form a unique shape that is also known as a material’s spectral signature.
Vegetation interacts with solar radiation in a different way than other natural materials. The vegetation spectrum (figure 1) typically absorbs in the red and blue wavelengths, reflects in the green wavelength, strongly reflects in the near infrared (NIR) wavelength, and displays strong absorption features in wavelengths where atmospheric water is present. Different plant materials, water content, pigment, carbon content, nitrogen content, and other properties cause further variation across the spectrum. Measuring these variations and studying their relationship to one another can provide meaningful information about plant health, water content, environmental stress, and other important characteristics. These relationships are often described as vegetation indices (VIs).
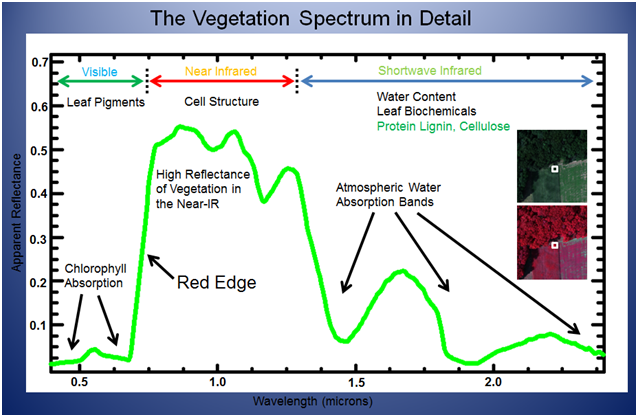
Figure 1
Source: Elowitz, Mark R. “What is Imaging Spectroscopy (Hyperspectral Imaging)?”. Retrieved November 27, 2013, from www.markelowitz.com/Hyperspectral.html
Sensor Considerations
Within the electromagnetic spectrum (figure 2), the solar-reflected optical spectrum spans a wavelength range from approximately 400 nanometers (nm) to approximately 3000nm. Of this range, the 400nm to 2500nm region is routinely measured using a variety of earth-observing satellite and airborne optical sensors. The optical spectrum is partitioned into four distinct wavelength ranges:
- Visible: 400nm to 700nm (the color blue is approximately 475nm, green is approximately 510nm and red is approximately 650nm)
- Near-infrared (NIR): 700nm to 1300nm
- Shortwave infrared 1 (SWIR-1): 1300nm to 1900nm
- Shortwave infrared 2 (SWIR-2): 1900nm to 2500nm
The transition from NIR to SWIR-1 is marked by the 1400nm atmospheric water absorption region in which satellites and aircraft cannot acquire measurements. Similarly, the SWIR-1 and SWIR-2 transition is marked by the 1900nm atmospheric water absorption region.
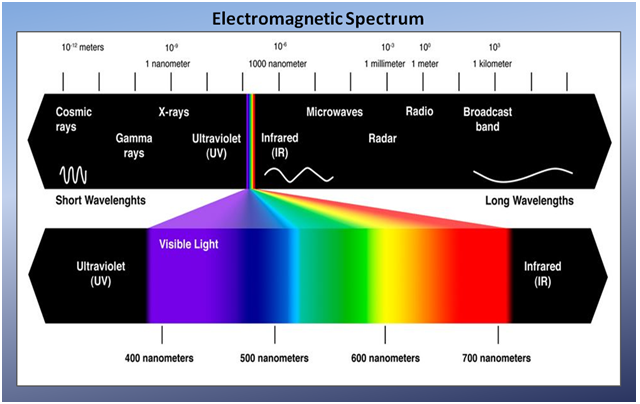
Figure 2
Source: Zami, Zuly. “The Electromagnetic Spectrum”. Retrieved December 3, 2013, from www.zulyzami.com/The+Electromagnetic+Spectrum
The ability of an optical sensor to resolve features within specific wavelengths of the optical spectrum and slice wavelengths into smaller increments is referred to as a sensor’s spectral resolution. The spectral resolution of a sensor can range anywhere from single-band black and white (panchromatic) to hyperspectral (figure 3). Images captured by a hyperspectral sensor can contain hundreds of individual bands, giving a near-continuous reading of the optical spectrum. Perhaps the most common and readily available type of remotely-sensed imagery is multispectral, which typically contains anywhere from 3 to 15 bands that have been chosen carefully along the optical spectrum. Many years of published scientific research focused on the spectral changes experienced when vegetation undergoes changes in content of water, pigments, nutrients, and other properties have led to the inclusion of bands on a number of earth-observing satellites and airborne sensors that focus on the regions of the electromagnetic spectrum that are sensitive to fluctuations in vegetation properties. Understanding the spectral resolution of your data is crucial to working effectively with Vegetation Indices, which often require data from very specific regions of the optical spectrum.
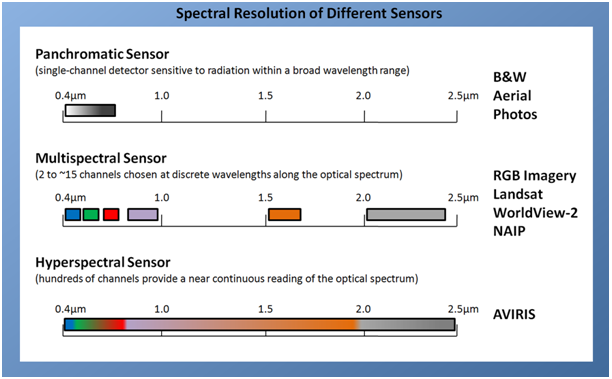
Figure 3
Vegetation Indices in ENVI
Over time and through many scientific studies, remote sensing experts have come to understand how combinations of the measured reflectance properties at two or more wavelengths reveal specific vegetation characteristics, also known as VIs. There are more than 150 existing VIs, with additional indices emerging as sensors advance and provide new information. ENVI exposes 27 of these indices which were selected based upon their robustness, scientific basis, and applicability. These 27 indices are divided into seven categories described as follows:
- Broadband Greenness
- Narrowband Greenness
- Light Use Efficiency
- Canopy Nitrogen
- Dry or Senescent Carbon
- Leaf Pigment
- Canopy Water Content
Each of the above-listed categories has one or more index that is used to estimate the presence (or absence) of a specific property. These indices are discussed in more detail below.
Broadband Greenness
Broadband greenness describes the vigor and health of green vegetation. They are combinations of reflectance measurements that are sensitive to the combined effects of foliage chlorophyll concentration, canopy leaf area, foliage clumping, and canopy architecture. These VIs are designed to provide a measure of the overall amount and quality of photosynthetic material in vegetation, which is essential for understanding the state of vegetation for any purpose. For these VIs, the strong reflective properties in the NIR wavelengths are compared with the strong absorption features of vegetation in the red wavelengths. These comparisons define the Normalized Difference Vegetation Index (NDVI), Simple Ratio Index, Enhanced Vegetation Index, Atmospherically Resistant Vegetation Index, and the Sum Green Index.
Normalized Difference Vegetation Index (NDVI):
The NDVI is perhaps the most well known and often used vegetation index. The NDVI is a simple, but effective VI for quantifying green vegetation. The NDVI normalizes green leaf scattering in the near-infrared wavelength and chlorophyll absorption in the red wavelength.
NDVI = (NIR – RED) / (NIR + RED)
The value range of an NDVI is -1 to 1 where healthy vegetation generally falls between values of 0.20 to 0.80.
Simple Ratio Index (SR):
The SR is also well known and often used. It is described as the ratio of light that is scattered in the NIR range to that which is absorbed in the red range.
SR = NIR / RED
The range of values is from 0 to more than 30, where healthy vegetation generally falls between values of 2 to 8.
Enhanced Vegetation Index (EVI):
In areas of dense canopy where the leaf area index (LAI) is high, the NDVI values can be improved by leveraging information in the blue wavelength. Information in this portion of the spectrum can help correct for soil background signals and atmospheric influences.
EVI = 2.5[(NIR – RED) / ((NIR) + (6RED) - (7.5BLUE) + 1)]
The range of values for the EVI is -1 to 1, where healthy vegetation generally falls between values of 0.20 to 0.80.
Atmospherically Resistant Vegetation Index (ARVI):
The ARVI is an enhancement to the NDVI that is relatively resistant to atmospheric factors such as aerosol. It works by using reflectance measurements in the blue wavelengths to correct for atmospheric scattering effects that register in the red reflectance spectrum. The ARVI is most useful in regions of high atmospheric aerosol content.
ARVI = ((NIR) - (2RED - BLUE) / (NIR) + (2RED - BLUE))
The range for an ARVI is -1 to 1 where green vegetation generally falls between values of 0.20 to 0.80.
Sum Green Index (SG):
This SG is generally used to detect changes in vegetation greenness. This is useful in detecting forest disturbance because it is highly sensitive to small changes in vegetation canopy opening.
The SG is the mean of reflectance across the 500 nm to 600 nm portion of the spectrum. This sum is then normalized by the number of bands to convert it back to units of reflectance. The value of this index ranges from 0 to more than 50 (in units of % reflectance). The common range for green vegetation is 10 to 25 percent reflectance.
Narrowband Greenness
Similar to the broadband greenness VIs, narrowband greenness VIs are designed to provide a measure of the overall amount and quality of photosynthetic material in vegetation. These VIs use reflectance measurements in the red and near-infrared regions to sample the red edge portion of the reflectance curve. The red edge is a name used to describe the steeply sloped region of the vegetation reflectance curve between 690nm and 740nm that is caused by the transition from chlorophyll absorption and near-infrared leaf scattering. Use of near-infrared measurements, with much greater penetration depth through the canopy than red measurements, allows estimation of the total amount of green material in the column. Narrowband greenness VIs are more sophisticated measures of general quantity and vigor of green vegetation than the broadband greenness VIs. Making narrowband measurements in the red edge allows these indices to be more sensitive to smaller changes in vegetation health than the broadband greenness VIs, particularly in conditions of dense vegetation where the broadband measures can saturate. Narrowband greenness VIs are intended for use with high spectral resolution imagery, such as that acquired by hyperspectral sensors.
Red Edge Normalized Difference Vegetation Index (NDVI705):
The NDVI705 is a modification of the broadband NDVI. It is intended for use with very high spectral resolution reflectance data, such as data from hyperspectral sensors. The NDVI705 differs from the NDVI by using bands along the red edge, instead of the main absorption and reflectance peaks. The NDVI705 capitalizes on the sensitivity of the vegetation red edge to small changes in canopy foliage content, gap fraction, and senescence. Applications include precision agriculture, forest monitoring, and vegetation stress detection.
NDVI705 = (750nm - 705nm) / (750nm + 705nm)
The values of this index range from -1 to 1. The common range for green vegetation is between values of 0.2 to 0.9.
Modified Red Edge Simple Ratio Index (mSR705):
The mSR705 is a modification of the traditional broadband SR. It differs from the standard SR because it uses bands in the red edge and incorporates a correction for leaf specular reflection. Applications include precision agriculture, forest monitoring, and stressed vegetation detection.
mSR705 = (750nm - 445nm) / (705nm - 445nm)
The values of this index range from 0 to 30. The common range for green vegetation is between values of 2 to 8.
Modified Red Edge Normalized Difference Vegetation Index (mNDVI705):
The mNDVI705 is a modification of the NDVI705. It differs from the NDVI705 by incorporating a correction for leaf specular reflection. The mNDVI705 capitalizes on sensitivity of the vegetation red edge to small changes in canopy foliage content, gap fraction, and senescence. Applications include precision agriculture, forest monitoring, and vegetation stress detection.
mNDVI705 = (750nm - 705nm) / (750nm + 705nm - (2 * 445nm))
The values of this index range from -1 to 1, with the common range for green vegetation falling between 0.2 and 0.7.
Vogelmann Red Edge Index 1 (VOG1):
The VOG1 is a narrowband reflectance measurement that is sensitive to the combined effects of foliage chlorophyll concentration, canopy leaf area, and water content. Applications include vegetation phenology (growth) studies, precision agriculture, and vegetation productivity modeling.
VOG1 = 740nm / 720nm
The values of this index range from 0 to 20. The common range for green vegetation is from 4 to 8.
Vogelmann Red Edge Index 2 (VOG2):
The VOG2 is a narrowband reflectance measurement that is sensitive to the combined effects of foliage chlorophyll concentration, canopy leaf area, and water content. Applications include vegetation phenology studies, precision agriculture, and vegetation productivity modeling.
VOG2 = (734nm - 747nm) / (715nm + 726nm)
The values of this index range from 0 to 20. The common range for green vegetation is from 4 to 8.
Vogelmann Red Edge Index 3 (VOG3):
The VOG3 is a narrowband reflectance measurement that is sensitive to the combined effects of foliage chlorophyll concentration, canopy leaf area, and water content. Applications include vegetation phenology studies, precision agriculture, and vegetation productivity modeling.
VOG3 = (734nm - 747nm) / (715nm + 720nm)
The values of this index range from 0 to 20. The common range for green vegetation is from 4 to 8.
Red Edge Position Index (REP):
The REP is a narrowband reflectance measurement that is sensitive to changes in chlorophyll concentration. Increased chlorophyll concentration broadens the absorption feature and moves the red edge to longer wavelengths. The red edge position refers to the wavelength of steepest slope within the range of 690nm to 740nm. The common range for green vegetation is 700nm to 730nm.
Results represent the wavelength of the maximum derivative of reflectance in the vegetation red edge region of the spectrum in microns from 0.69 microns to 0.74 microns. Applications include crop monitoring and yield prediction, ecosystem disturbance detection, photosynthesis modeling, and canopy stress caused by climate and other factors.
Light Use Efficiency
The light use efficiency indices provide ways to quantify vegetation’s ability to use incident light for photosynthesis. Considering the broad electromagnetic spectrum, only a small range is actually utilized by plants during photosynthesis. This range happens to fall within the visible portion of the spectrum, from 400nm to 700nm. A plant’s ability to efficiently absorb energy within this range can be a good predictor of growth rate and biomass production. ENVI includes three vegetation indices to measure light use efficiency: Photochemical Reflectance Index, Structure Insensitive Pigment Index, and Red Green Ration Index.
Photochemical Reflectance Index (PRI):
The PRI takes advantage of the changes to carotenoid pigments, specifically the xanthophylls pigments (yellows) that are absorbed by live foliage. These pigments signify photosynthetic light use efficiency and are useful to quantify vegetation production and stress. This index is particular useful for measuring vegetation health prior to senescence.
PRI = (531nm - 570nm) / (531nm + 570nm)
The range for a PRI is -1 to 1, where healthy vegetation generally falls between values of -0.2 to 0.2.
Structure Insensitive Pigment Index (SIPI):
The SIPI is a good index to use in areas with high variability in the canopy structure, or leaf area index. This index maximizes sensitivity to the ratio of bulk carotenoids to chlorophyll while minimizing the impact of the variable canopy structure.
SIPI = (800nm – 445nm) / (800nm – 680nm)
The range of a SIPI is from 0 to 2, where healthy green vegetation is from 0.8 to 1.8.
Red Green Ratio Index (RGR Ratio):
This index is a reflectance measurement useful for making foliage development estimations, indicating leaf production and stress, or even indicating flowering in some canopies. The ratio measures the relative expression of leaf redness caused by anthocyanin to that of chlorophyll.
RGR Ratio = mean(RED) / mean(GREEN)
Where mean(RED) represents all bands with wavelengths in the red range of the electromagnetic spectrum and mean(GREEN) represents all bands with wavelengths in the green range of the electromagnetic spectrum. The range of a RGR Ratio is from 0.1 to more than 8, where healthy green vegetation usually falls between values of 0.7 to 3.
The canopy nitrogen indices provide a measure of nitrogen concentration in remotely-sensed foliage. Plants experiencing rapid growth generally also contain a high concentration of nitrogen, which is sensed in the SWIR wavelength. High measured reflectance in this wavelength indicates relatively large nitrogen concentration.
Normalized Difference Nitrogen Index (NDNI):
High reflectance at 1510nm indicates both high nitrogen concentration and overall biomass in foliage. Conversely, reflectance values at 1680nm contain similar signal due to foliar biomass without the influence of nitrogen absorption. This relationship is used to measure the strong sensitivity to changing nitrogen status when the canopy is green. Applications include precision agriculture, ecosystem analysis, and forest management.
NDNI = (log1 1510nm) - (log1 1680nm)/ (log1 1510nm) + (log1 1680nm)
The value ranges from 0 to 1. The common range for green vegetation is 0.02 to 0.1.
Dry or Senescent Carbon
The dry or senescent carbon vegetation indices exploit characteristics found in vegetation components during senescence such as changes to lignin and cellulose. Lignin is used by plants to make structural components such as woody stems. Cellulose is used for cellular tissue structure. When vegetation undergoes or is about to undergo senescence, the concentration of these materials can increase. These increases make the vegetation material highly flammable; therefore these indices are excellent for fire fuel analyses.
Normalized Difference Lignin Index (NDLI):
The NDLI is designed to estimate the relative amounts of lignin contained in vegetation canopies. High reflectance at 1754nm is largely determined by the lignin concentration of leaves, as well as the overall foliage biomass of the canopy. Reflectance at 1680nm is used as a reference. The Normalized Difference Lignin Index is highly experimental.
NDLI = (log1 1754nm) - (log1 1680nm) / (log1 1754nm) + (log1 1680nm)
The value of this index ranges from 0 to 1. The common range for green vegetation is 0.005 to 0.05.
Cellulose Absorption Index (CAI):
The CAI quantifies exposed surfaces that contain dried plant material. Strong absorption features present in the 2000nm to 2200nm range indicate strong presence of cellulose. Crop residue monitoring, plant canopy senescence, fire fuel conditions, and grazing management are some applications for this index.
CAI = 0.5(2000nm + 2200nm) - 2100nm
The value range of this index ranges from -3 to more than 4. The common range for green vegetation is -2 to 4.
Plant Senescence Reflectance Index (PSRI):
The PSRI is designed to maximize sensitivity of the index to the ratio of bulk carotenoids (for example, alpha-carotene and beta-carotene) to chlorophyll. An increase in PSRI indicates increased canopy stress (carotenoid pigment), the onset of canopy senescence, and plant fruit ripening. Applications include vegetation health monitoring, plant physiological stress detection and crop production, and yield analysis.
PSRI = (680nm - 500nm) / 750nm
For this index, values range from -1 to 1, with the common range of values for green vegetation being between -0.1 to 0.2.
Leaf Pigment
The leaf pigment vegetation indices are designed to provide a measure of stress-related pigments present in vegetation. Stress-related pigments include carotenoids (yellow pigments) and anthocyanins (pink, purple and red pigments), which tend to be present in higher concentrations when vegetation is in a weakened state. Carotenoids function in light absorption processes in plants, as well as in protecting plants from the harmful effects of high light conditions. Anthocyanins are water-soluble pigments abundant in newly-formed leaves and leaves undergoing senescence. The leaf pigment vegetation indices do not measure chlorophyll, which is instead measured using the greenness indices. Applications for leaf pigment vegetation indices include crop monitoring, ecosystem studies, analyses of canopy stress, and precision agriculture.
Carotenoid Reflectance Index 1 (CRI1):
The CRI1 is a reflectance measurement that is sensitive to carotenoid pigments in plant foliage. Estimation of leaf carotenoid content from reflectance is much more difficult than estimation of chlorophyll because of the overlap between chlorophyll and carotenoid absorption peaks and because of the higher concentration of chlorophyll than carotenoid in most leaves. At 510nm, the reciprocal reflectance of carotenoid is maximal, but this value is also influenced by chlorophyll. To remove the effect of chlorophyll, the reciprocal reflectance at 550nm is used, which is influenced more purely by chlorophyll alone. Higher CRI1 values mean greater carotenoid concentration relative to chlorophyll.
CRI1 = (1/510nm) - (1/550nm)
The values of this index range from 0 to more than 15. The common range for green vegetation is between values of 1 to 12.
Carotenoid Reflectance Index 2 (CRI2):
The CRI2 is a reflectance measurement that is sensitive to carotenoid pigments in plant foliage. The CRI2 is a modification of CRI1. The reciprocal reflectance at 700nm is used to remove the effect of chlorophyll on the reciprocal reflectance at 510nm. It provides better results in areas of high carotenoid concentration. Higher CRI2 values mean greater concentration of carotenoid relative to chlorophyll.
CRI2 = (1/510nm) - (1/700nm)
The values of this index range from 0 to more than 15. The common range for green vegetation is between values of 1 to 11.
Anthocyanin Reflectance Index 1 (ARI1):
The ARI1 is a reflectance measurement that is sensitive to anthocyanin in plant foliage. The reciprocal reflectance of anthocyanin is highest around 550nm; however, the reciprocal reflectance value at 550nm is also influenced by chlorophyll. The reciprocal reflectance at 700nm is used as a measure of chlorophyll content to remove the chlorophyll contribution from reflectance around 550nm. Increases in ARI1 indicate changes in foliage via new growth or death.
ARI1 = (1/550nm) - (1/700nm)
The values of this index range from 0 to more than 0.2. The common range for green vegetation is between values of 0.001 to 0.1.
Anthocyanin Reflectance Index 2 (ARI2):
The ARI2 is a reflectance measurement that is sensitive to anthocyanins in plant foliage. Increases in ARI2 indicate canopy changes in foliage via new growth or death. The ARI2 is a modification of the ARI1 which detects higher concentrations of anthocyanins in vegetation.
ARI2 = 800nm [(1/550nm) - (1/700nm)]
The values of this index range from 0 to 0.2. The common range for green vegetation is 0.001 to 0.1.
Canopy Water Content
The canopy water content vegetation indices are designed to provide a measure of the amount of water contained in the foliage canopy. Water content is an important quantity of vegetation because higher water content often indicates healthier vegetation that is likely to grow faster and be more fire-resistant. Canopy water content vegetation indices use reflectance measurements in the near-infrared and shortwave infrared regions to take advantage of known absorption features of water and the penetration depth of light in the near-infrared region to make integrated measurements of total column water content. In comparison to greenness indices, canopy water content indices are able to “see” more deeply into thick canopies and have a preferential sensitivity to thin as opposed to thick tissues.
Water Band Index (WBI):
The WBI is a reflectance measurement that is sensitive to changes in canopy water content. As the water content of vegetation canopies increases, the strength of absorption around 970nm increases related to that of 900nm. Applications of the WBI include canopy stress analysis, productivity prediction and modeling, fire hazard condition analysis, cropland management, and studies of ecosystem physiology.
WBI = 900nm / 970nm
The common range of values for green vegetation is 0.8 to 1.2.
Normalized Difference Water Index (NDWI):
The NDWI is sensitive to changes in vegetation canopy water content because reflectance at 857nm and 1241nm has similar but slightly different liquid water absorption properties. The scattering of light by vegetation canopies enhances the weak liquid water absorption at 1241nm. Applications include forest canopy stress analysis, leaf area index studies in densely foliated vegetation, plant productivity modeling, and fire susceptibility studies.
NDWI = (857nm - 1241nm) / (857nm + 1241nm)
The values of this index range between -1 and 1. The common range for green vegetation is -0.1 to 0.4.
Moisture Stress Index (MSI):
The MSI is a reflectance measurement that is sensitive to increases in leaf water content. As the water content of leaves in vegetation canopies increases, the strength of absorption around 1599nm increases. Absorption at 819nm is nearly unaffected by changing water content, so it is used as a reference. Applications of the MSI include canopy stress analysis, productivity prediction and modeling, fire hazard condition analysis, and studies of ecosystem physiology. The MSI is inverted relative to other water VIs; higher values indicate greater water stress and less water content.
MSI = 1599nm / 819nm
The values of this index range from 0 to more than 3. The common range for green vegetation is 0.4 to 2.
Normalized Difference Infrared Index (NDII):
The NDII is a reflectance measurement that is sensitive to changes in water content of plant canopies. The NDII uses a normalized difference formulation instead of a simple ratio, and the index values increase with increasing water content. Applications include agricultural crop management, forest canopy monitoring, and stressed vegetation detection.
NDII = (819nm - 1649nm) / (819 + 1649nm)
The values of this index range from -1 to 1. The common range for green vegetation is between values of 0.02 to 0.6.
Conclusions
The VIs provided in ENVI are not designed to quantify the exact concentration or abundance of any given vegetation component. Instead, they are intended for use in geographically mapping relative amounts of vegetation components, which can then be interpreted in terms of ecosystem conditions. All VIs require high-quality reflectance measurements from either multispectral or hyperspectral sensors. Measurements in radiance units that have not been atmospherically corrected (by using ENVI Atmospheric Correction Module: QUAC® and FLAASH® or other atmospheric correction software) are unsuitable and typically provide poor results. The VIs that can be calculated on a specific dataset are determined by the spectral bands sampled in the input dataset. If all spectral bands required for a specific index are available, that VI is available for the dataset. For example, an input dataset from a sensor that matches only the near-infrared and red spectral bands (such as AVHRR, TM, and others) is only able to calculate two of the indices: the NDVI (Normalized Difference Vegetation Index) and SR (Simple Ratio). In contrast, for a high spectral resolution input dataset, such as AVIRIS, 25 of the indices will be available.
Each category of indices typically provides multiple techniques for estimating the presence or absence of a single vegetation property. For different properties and field conditions, some indices within a category provide results with higher validity than others. By comparing the results of different VIs in a category, and correlating these to field conditions measured on-site, you can assess which indices in a particular category do the best job of modeling the variability in your scene. By using the VI in any category that best models the measured field conditions for a few measurements, you can significantly increase the quality of the results from any further processing.
In addition to the 27 VIs exposed in ENVI, there are many additional VIs that have been published in scientific literature. New and emerging sensors with improved spectral resolution also allow scientists to modify existing indices, as well as create new indices that take advantage of unique wavelengths of the optical spectrum. The Band Math tool in ENVI allows users to incorporate any VI into their analysis by creating custom algorithms based upon the VI of choice.
References
Asner, G.P., 1998, Biophysical and Biochemical Sources of Variability in Canopy Reflectance, Remote Sensing of Environment, 64:234-253.
Ceccato, P., S. Flasse, S. Tarantola, S. Jacquemoud, and J.M. Gregoire, 2001. Detecting Vegetation Leaf Water Content Using Reflectance in the Optical Domain. Remote Sensing of Environment 77:22-33.
Champagne, C., E. Pattey, A. Bannari, and I.B. Stratchan, 2001. Mapping Crop Water Status: Issues of Scale in the Detection of Crop Water Stress Using Hyperspectral Indices. Proceedings of the 8th International Symposium on Physical Measurements and Signatures in Remote Sensing, Aussois, France. Pp.79-84.
Curran, P.J., Windham, W.R., and H.L. Gholz, 1995. Exploring the Relationship Between Reflectance Red Edge and Chlorophyll Concentration in Slash Pine Leaves. Tree Physiology 15:203-206.
Datt, B., 1999. A New Reflectance Index for Remote Sensing of Chlorophyll Content in Higher Plants: Tests Using Eucalyptus Leaves. Journal of Plant Physiology 154:30-36.
Daughtry, C.S.T., 2001. Discriminating Crop Residues from Soil by Short-Wave Infrared Reflectance. Agronomy Journal 93:125-131.
Daughtry, C.S.T., E.R. Hunt Jr., and J.E. McMurtrey III. 2004. Assessing Crop Residue Cover Using Shortwave Infrared Reflectance. Remote Sensing of Environment 90:126-134.
Elowitz, Mark R. “What is Imaging Spectroscopy (Hyperspectral Imaging)?”. Retrieved November 27, 2013, from http://www.markelowitz.com/Hyperspectral.html
Fourty, T., F. Baret, S. Jacquemoud, G. Schmuck, and J. Verdebout, 1996. Leaf Optical Properties with Explicit Description of Its Biochemical Composition: Direct and Inverse Problems. Remote Sensing of Environment 56:104-117.
Gamon, J.A., J. Penuelas, and C.B. Field, 1992. A Narrow-Waveband Spectral Index That Tracks Diurnal Changes in Photosynthetic Efficiency. Remote Sensing of Environment 41:35-44.
Gamon, J.A., L. Serrano, and J.S. Surfus, 1997. The Photochemical Reflectance Index: An Optical Indicator of Photosynthetic Radiation Use Efficiency Across Species, Functional Types and Nutrient Levels. Oecologia 112:492-501.
Gamon, J.A. and J.S. Surfus, 1999. Assessing Leaf Pigment Content and Activity With a Reflectometer. New Phytologist 143:105-117.
Gao, B.C., 1995. Normalized Difference Water Index for Remote Sensing of Vegetation Liquid Water from Space. Proceedings of SPIE 2480: 225-236.
Gitelson, A.A. and M.N. Merzlyak, 1994. Spectral Reflectance Changes Associated with Autumn Senescence of Aesculus Hippocastanum L. and Acer Platanoides L. Leaves. Spectral Features and Relation to Chlorophyll Estimation. Journal of Plant Physiology 143:286 292.
Gitelson, A.A., M.N. Merzlyak, and O.B. Chivkunova, 2001. Optical Properties and Nondestructive Estimation of Anthocyanin Content in Plant Leaves. Photochemistry and Photobiology 71:38-45.
Gitelson, A.A., Y. Zur, O.B. Chivkunova, and M.N. Merzlyak, 2002. Assessing Carotenoid Content in Plant Leaves with Reflectance Spectroscopy. Photochemistry and Photobiology 75:272-281.
Hardisky, M.A., V. Klemas, and R.M. Smart, 1983. The Influences of Soil Salinity, Growth Form, and Leaf Moisture on the Spectral Reflectance of Spartina Alterniflora Canopies. Photogrammetric Engineering and Remote Sensing 49:77-83.
Hunt Jr., E.R. and B.N. Rock, 1989. Detection of Changes in Leaf Water Content Using Near- And Middle-Infrared Reflectances. Remote Sensing of Environment 30:43-54.
Jackson, T.L., D. Chen, M. Cosh, F. Li, M. Anderson, C. Walthall, P. Doriaswamy, and E.R. Hunt, 2004. Vegetation Water Content Mapping Using Landsat Data Derived Normalized Difference Water Index for Corn and Soybeans. Remote Sensing of Environment 92:475-482.
Main, R., M.A. Cho, R. Mathieu, M.M. O’Kennedy, A. Ramoelo, S. Koch. An Investigation into robust spectral indices for leaf chlorophyll estimation. Journal of Photogrammetry and Remote Sensing 66 (6): 751-761.
Merzlyak, J.R., A.A. Gitelson, O.B. Chivkunova, and V.Y. Rakitin, 1999. Non-destructive Optical Detection of Pigment Changes During Leaf Senescence and Fruit Ripening. Physiologia Plantarum 106:135-141.
Hardisky, M.A., V. Klemas, and R.M. Smart, 1983. The Influences of Soil Salinity, Growth Form, and Leaf Moisture on the Spectral Reflectance of Spartina Alterniflora Canopies. Photogrammetric Engineering and Remote Sensing 49:77-83.
Huete, A.R., H. Liu, K. Batchily, and W. van Leeuwen, 1997. A Comparison of Vegetation Indices Over a Global Set of TM Images for EOS-MODIS. Remote Sensing of Environment 59(3):440-451.
Jackson, T.L., D. Chen, M. Cosh, F. Li, M. Anderson, C. Walthall, P. Doriaswamy, and E.R. Hunt, 2004. Vegetation Water Content Mapping Using Landsat Data Derived Normalized Difference Water Index for Corn and Soybeans. Remote Sensing of Environment 92:475-482.
Jackson, R.D., P.N. Slater, and P.J. Pinter, 1983. Discrimination of Growth and Water Stress in Wheat by Various Vegetation Indices Through Clear and Turbid Atmospheres. Remote Sensing of the Environment 15:187-208.
Kaufman, Y.J. and D. Tanre, 1996. Strategy for Direct and Indirect Methods for Correcting the Aerosol Effect on Remote Sensing: from AVHRR to EOS-MODIS. Remote Sensing of Environment 55:65-79.
Lobell, D.B. and G.P. Asner, 2003. Hyperion studies of crop stress in Mexico. Proceedings of the 12th Annual JPL Airborne Earth Science Workshop. Pasadena, CA. (ftp://popo.jpl.nasa.gov/pub/docs/workshops/aviris.proceedings.html).
Melillo, J.M., J.D. Aber, and J.F. Muratore, 1982. Nitrogen and Lignin Control of Hardwood Leaf Litter Decomposition Dynamics. Ecology 63:621-626.
Merzlyak, J.R., A.A. Gitelson, O.B. Chivkunova, and V.Y. Rakitin, 1999. Non-destructive Optical Detection of Pigment Changes During Leaf Senescence and Fruit Ripening. Physiologia Plantarum 106:135-141.
Penuelas, J., F. Baret, and I. Filella, 1995. Semi-Empirical Indices to Assess Carotenoids/Chlorophyll-a Ratio from Leaf Spectral Reflectance. Photosynthetica 31:221-230.
Penuelas, J., I. Filella, C. Biel, L. Serrano, and R. Save, 1995. The Reflectance at the 950-970 Region as an Indicator of Plant Water Status. International Journal of Remote Sensing 14:1887-1905.
Rouse, J.W., R.H. Haas, J.A. Schell, and D.W. Deering, 1973. Monitoring Vegetation Systems in the Great Plains with ERTS. Third ERTS Symposium, NASA SP-351 I: 309-317.
Sellers, P.J., 1985. Canopy Reflectance, Photosynthesis and Transpiration. International Journal of Remote Sensing 6:1335-1372.
Serrano, L., J. Penuelas, and S.L. Ustin, 2002. Remote Sensing of Nitrogen and Lignin in Mediterranean Vegetation from AVIRIS Data: Decomposing Biochemical from Structural Signals. Remote Sensing of Environment 81:355-364.
Sims, D.A. and J.A. Gamon, 2002. Relationships Between Leaf Pigment Content and Spectral Reflectance Across a Wide Range of Species, Leaf Structures and Developmental Stages. Remote Sensing of Environment 81:337-354.
Sims, D.A. and J.A. Gamon, 2002. Estimation of vegetation water content and photosynthetic tissue area from spectral reflectance: a comparison of indices based on liquid water and chlorophyll absorption features. Remote Sensing of Environment 84: 526-537.
Tucker, C.J., 1979. Red and Photographic Infrared Linear Combinations for Monitoring Vegetation. Remote Sensing of the Environment 8:127-150.
Tuominen, J., T. Lipping, V. Kuosmanen, and R. Haapanen, 2009. Remote Sensing of Forest Health. Geoscience and Remote Sensing. Pei-Gee Peter Ho (Ed.), ISBN: 978-953-307-003-2, InTech.
Vogelmann, J.E., B.N. Rock, and D.M. Moss, 1993. Red Edge Spectral Measurements from Sugar Maple Leaves. International Journal of Remote Sensing 14:1563-1575.
Zami, Zuly. “The Electromagnetic Spectrum”. Retrieved December 3, 2013, from http://www.zulyzami.com/The+Electromagnetic+Spectrum