14663
Contour colorbar successful with IDL 8.1 weird labeling with IDL 8.2
Topic
In IDL 8.1, the COLORBAR function produced continuous colorbars of RGB tables. Therefore, when you produced a colorbar with IDL 8.1, it would include continuous gradient of the colors in the RGB table and could be labeled using the MAJOR, TICKVALUES, and TICKINTERVAL. For example, the code below can be used to generate a contour colorbar with IDL 8.1.
| pro test_make_cont_color_table
compile_opt idl2
d = dist(300)
;Get the version
ver = !VERSION.RELEASE
con_title = "IDL version " + ver
;create a contour with over 255 colors
con = contour(d,RGB_TABLE=39,c_value=findgen(256),/FILL, $
MARGIN=0.2, RGB_INDICES=bindgen(255), TITLE=con_title)
;create a vertical colorbar
col_bar = colorbar(TARGET=con,MAJOR=5, ORIENTATION=1)
end
|
The image saved from running this code with IDL 8.1 is shown below:
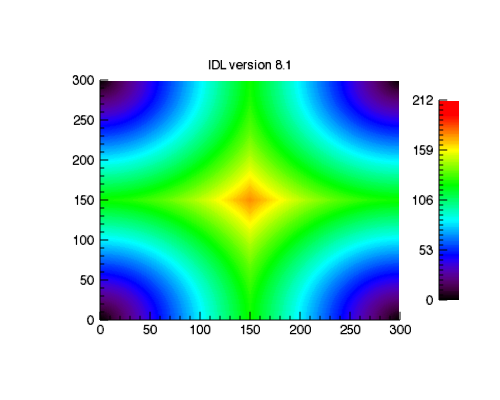
If you run the same code using IDL 8.2, the labels will not show up correctly. The image that is saved when running the code in IDL 8.2 is shown below:
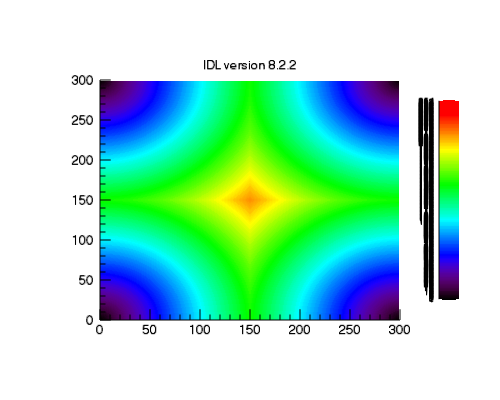
There is a reason the labels in the colorbar are messed up. IDL 8.2, if the TARGET keyword in COLORBAR is set to a contour image, than the COLORBAR will be discrete instead of continuous. This means that each color in the colorbar will have its own label. Thus, there are 256 tiny labels next to the colorbar which appear as black stripes.
Solution
In IDL 8.2 and greater, you can generate data independent colorbars. To do this, use the following criteria when calling the COLORBAR function:
-No TARGET
-Set the RANGE to the MIN and MAX data values
-Provide a position for the colorbar
After making these changes, the colorbar should have the same appearance it did in IDL 8.1. An example of how this can be done is shown below:
|
pro test_make_cont_color_table
compile_opt idl2
d = dist(300) ;create the data
ver = !VERSION.RELEASE ;get the version information
con_title = "IDL version " + ver ;create a title for the plot that states the version
con = contour(d,RGB_TABLE=39,c_value=findgen(256),/FILL, $
MARGIN=0.2, RGB_INDICES=bindgen(255), TITLE=con_title)
; If IDL version greater than IDL 8.1, create colorbar independent of CONTOUR
if (float(ver)gt 8.1) then begin
color_bar = colorbar(RGB_TABLE=39,Major=5,ORIENTATION=1, $
RANGE=[min(d),max(d)], POSITION=[0.9,0.2,0.95,0.75])
endif else begin
col_bar = colorbar(TARGET=con,MAJOR=5, ORIENTATION=1)
endelse
con.save, "idl_"+ver+".png", HEIGHT=400
end
|