13708
Display spectral profiles of multiple images in one single plot using ENVI 5.2
Assuming you have a time-series of multi-spectral (or hyper-spectral) image datasets of a study site. You are interested in obtaining the spectral profile at a specific pixel position from all of your multi-temporal image series, and you want to visualize the spectral profiles in one single profile plot. These are the steps to follow:
1. Open your images (File > Open)
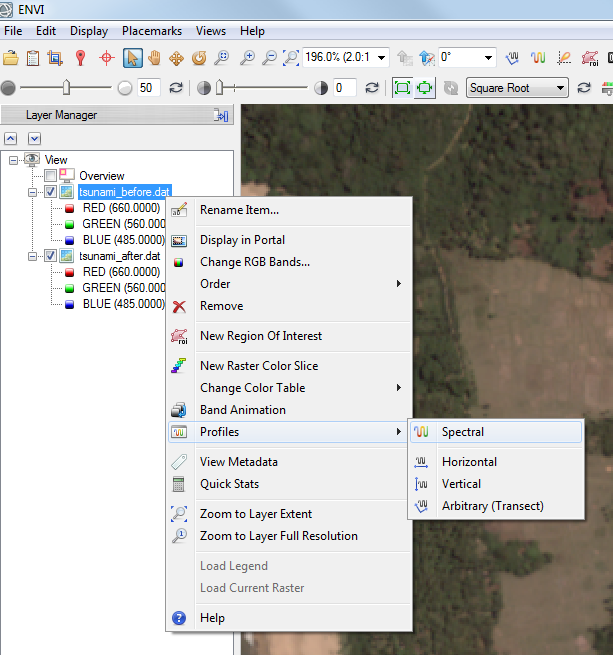
2. In one of your images, open the spectral profile plot (Right mouse click on image file name > "Profiles" > "Spectral"; or click on the corresponded button in the main icon bar). In the profile plot, you can now see the spectral profile at a specific pixel position in your selected image file
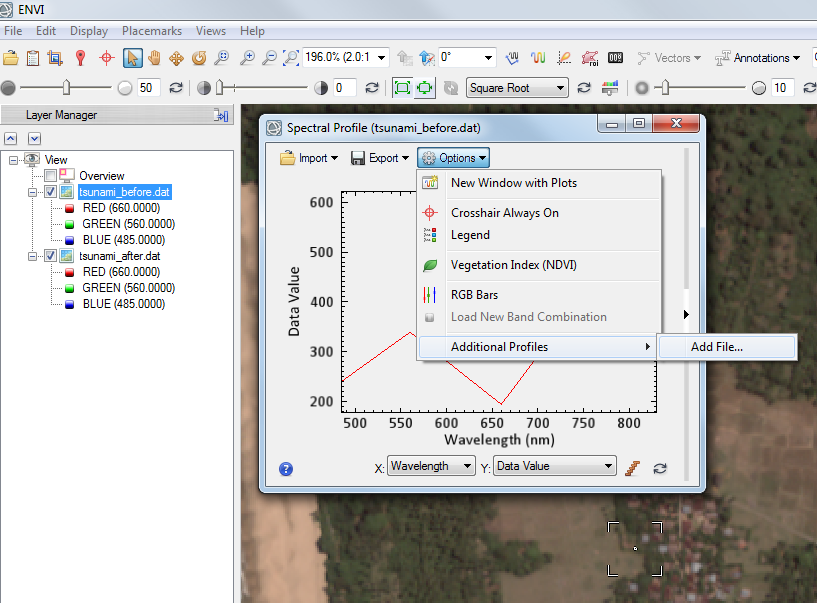
3. Add the spectral profile from another image at this pixel position to the plot (In the spectral profile plot, click on the "Options" button, select "Additional Profiles" > "Add file...". Selected your additional image)
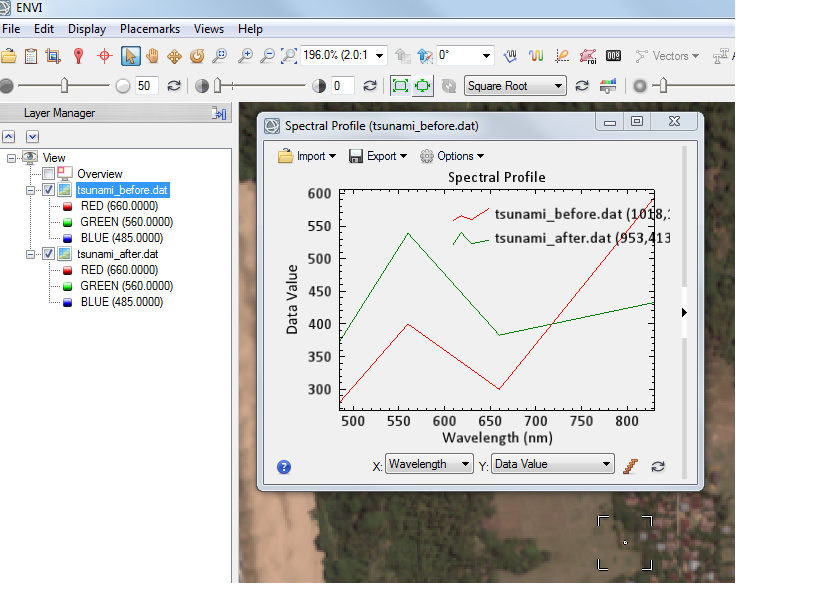
4. Add spectral profiles of other images to this plot by following the same steps as mentioned in 3)
For further questions please feel free to have a look or to post in our Exelis VIS Support Forum!
Review by MoMa, 2015-01-30