Streamline SAR Data Analysis with ENVI® SAR Essentials
ENVI SAR Essentials is designed to meet these challenges head-on, providing an intuitive and user-friendly platform for analyzing SAR data. Built with the user experience in mind, ENVI SAR Essentials offers simple tools and workflows that enable users, regardless of their SAR expertise, to seamlessly extract actionable information from SAR data. It integrates with the display and analytical tools found in ENVI, and its workflows are designed to mirror those used for optical imagery, allowing users to focus on results rather than configuring parameters. Here is a list of capabilities in ENVI SAR Essentials that D&I analysts can benefit from.
Basic Data Processing
The SAR Basic Data Processing tool processes Single Look Complex (SLC) data to create multi-looked, filtered, and geocoded SAR images that are ready for visual analysis. Automatic filtering reduces the speckled noise that is inherent to SAR data.
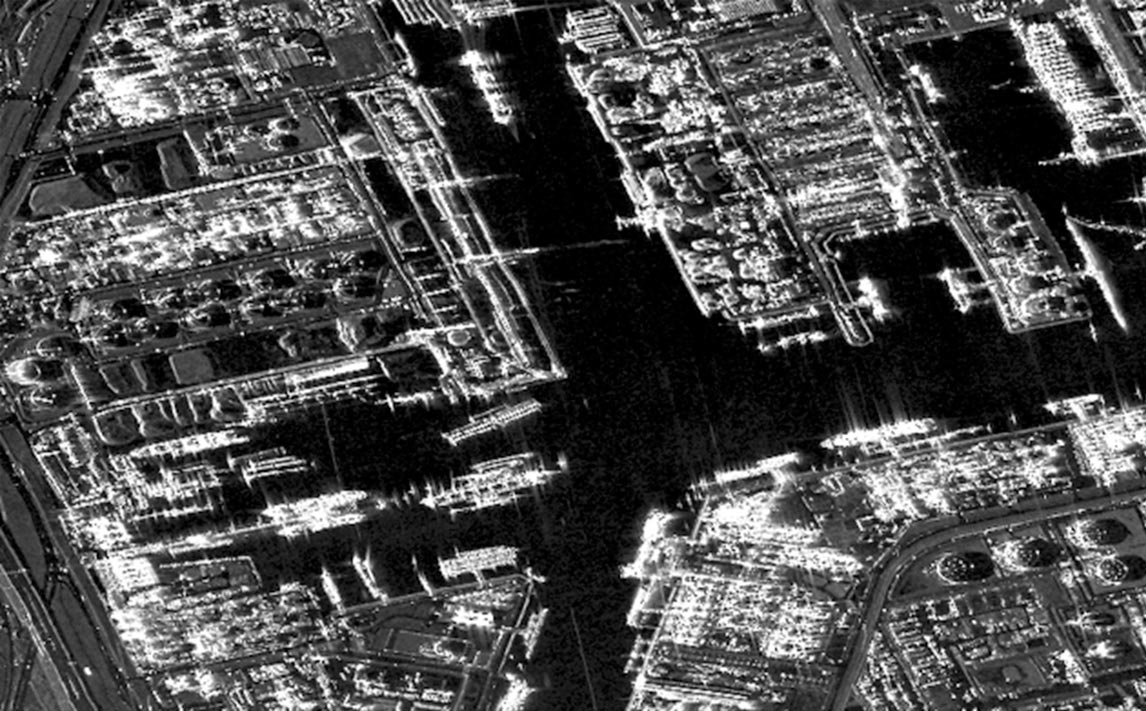
Geocoded, multi-looked, filtered image of Rotterdam Port, Netherlands. Source: Capella Space Open Data Gallery.
Detecting Moving Targets
Most SAR platforms operate in multiple collection modes. Examples include stripmap, sliding stripmap, spotlight, and dwell. The SAR Moving Target Detection tool renders moving objects as colored streaks. It works best with spotlight and dwell-mode acquisitions of 5 to 30 seconds. The resulting color sub aperture image highlights flat structures with distinct colors, which enables users to quickly locate man-made objects in areas with dense vegetation.
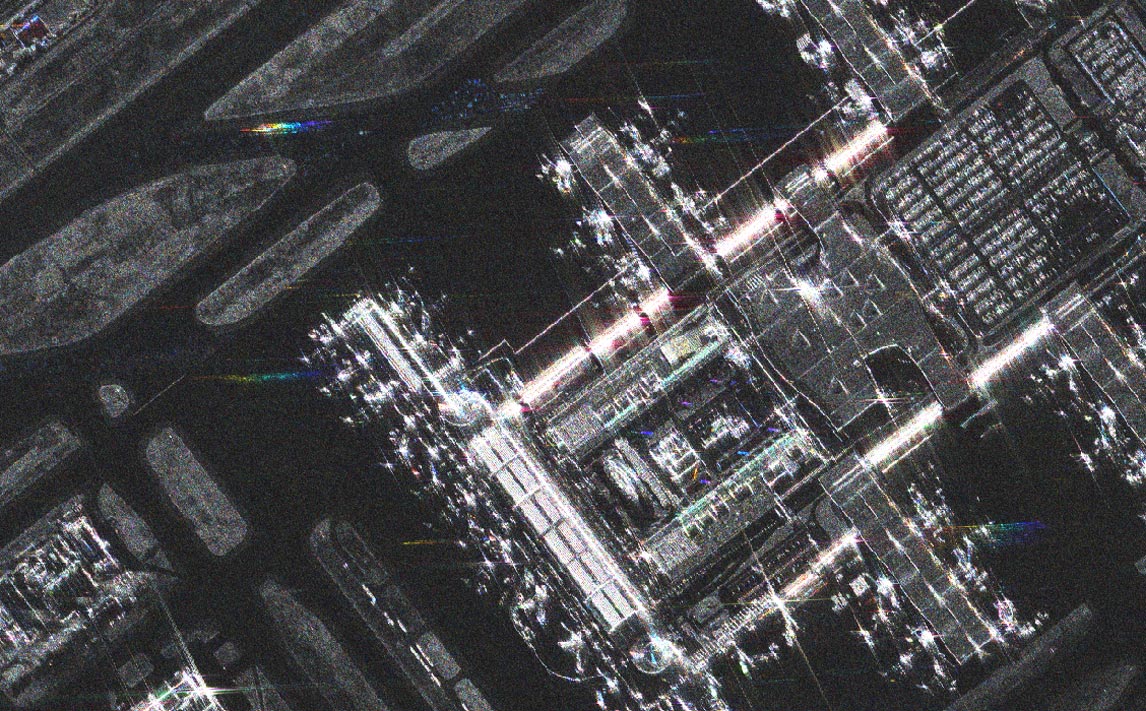
Color sub-aperture image of a town in Spain. Source: https://registry.opendata.aws/umbra-open-data/.
For longer dwell times, the SAR Dynamic Moving Target Detection tool creates dynamic aperture images that reveal the actual movement of objects, enhancing the detection of moving vehicles or aircraft.
The SAR Velocity Estimation tool provides a quick and simple way to estimate the velocities and directions of moving objects.
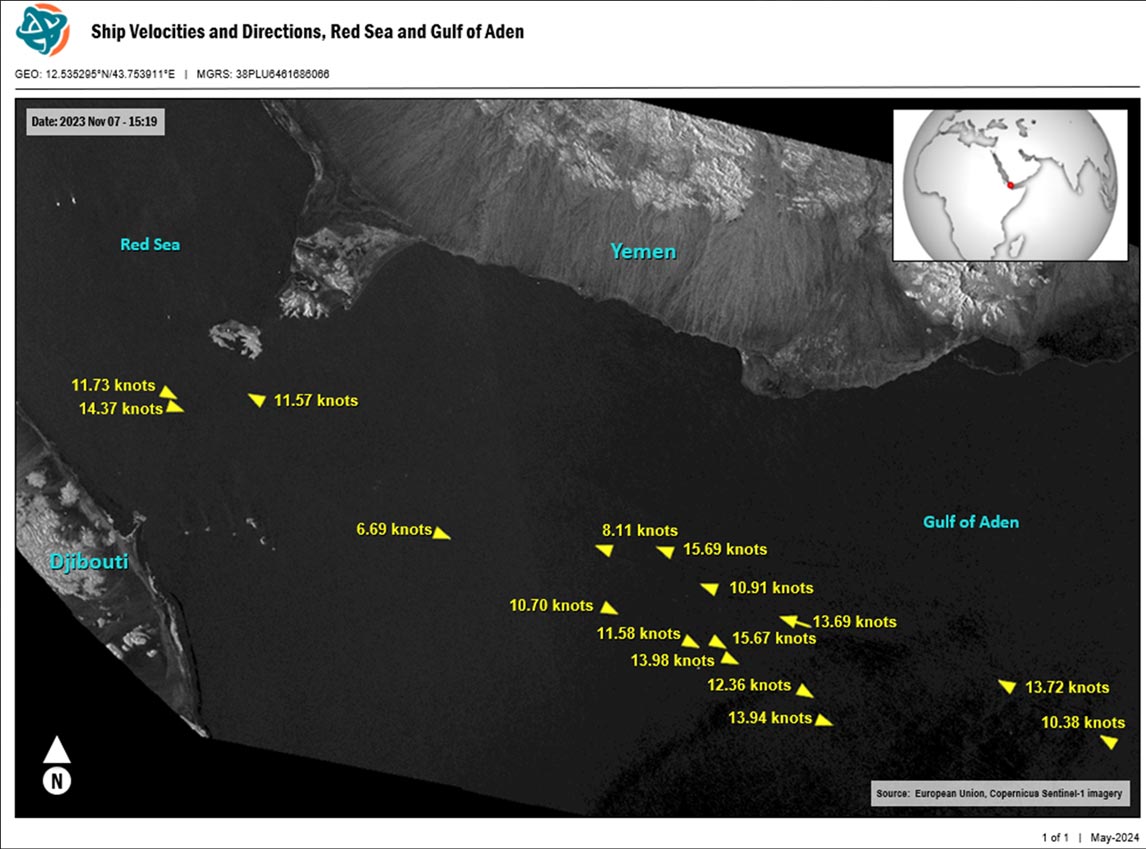
Map of ship locations, movement direction, and velocities in November of 2023. Source: European Union, Copernicus Sentinel-1 imagery.
In high-resolution SLC images with long dwell times, objects moving in the azimuth direction typically show up as blurred, “unfocused” streaks. This makes identification of moving objects difficult. The SAR Inverse-SAR Refocusing tool automatically identifies moving objects and refocuses them to reveal their true shapes.
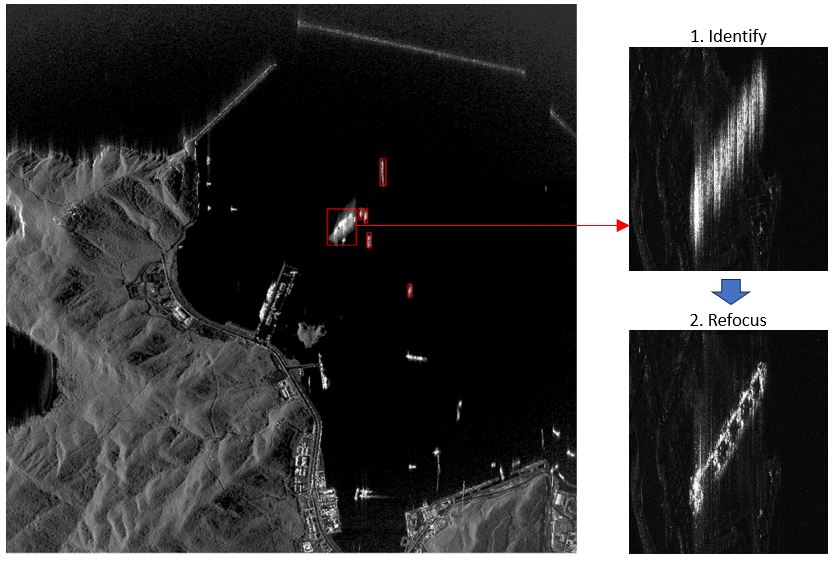
Example of detecting and refocusing a moving object, which is determined to be a cargo ship. Source: Capella Space Open Data Gallery.
Detecting Change
Amplitude Change Detection (ACD) leverages the amplitude portion of backscattered radar signals to assess broad-scale changes to surface features. The SAR Amplitude Change Detection tool creates an image where blue pixels indicate new features, while red pixels indicate features that are no longer present. This workflow is best used to monitor large-scale changes that occur across broad geographic regions.
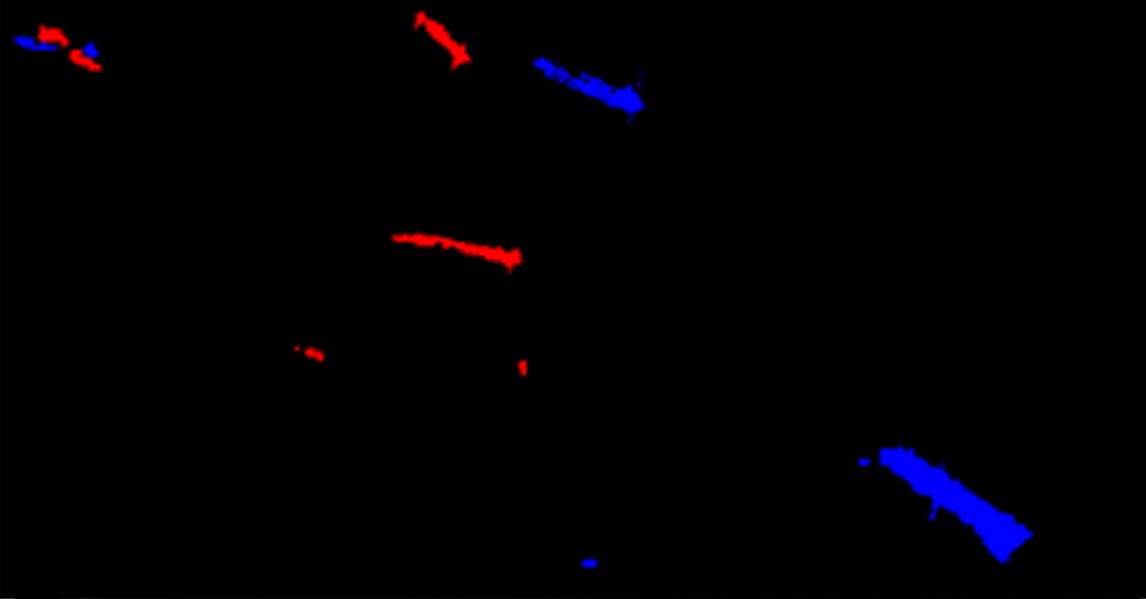
ACD classification image showing new vessels (blue) and those that are no longer present (red) in the Strait of Gibraltar. Source: Capella Space Open Data Gallery..
The SAR Amplitude Difference tool similarly detects changes between two SAR images. It is meant for quick visual assessments of change; the results are not as precise as those from ACD.
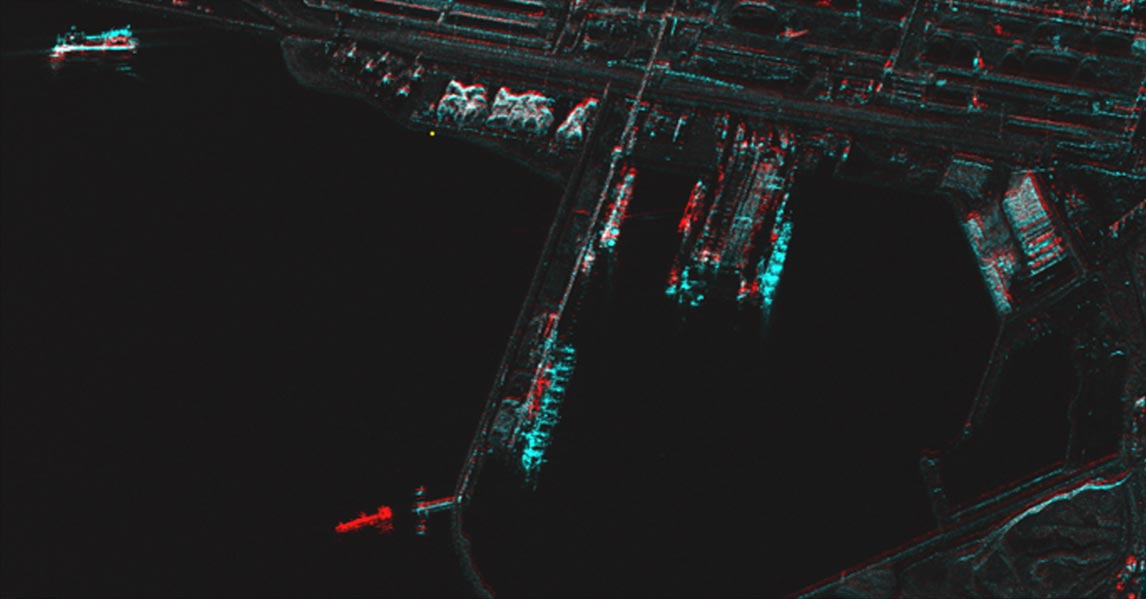
Amplitude difference image of a Turkish harbor. Source: Capella Space Open Data Gallery..
The SAR Coherent Change Detection workflow uses phase information in backscattered SAR signals to detect subtle changes to features on the Earth’s surface. CCD can detect changes as small as a few millimeters, making it useful for monitoring illegal construction, enemy troop movement, border security, threat assessment, and more. CCD is especially useful in rocky and arid areas, since dry soils provide more accurate coherence measurements.
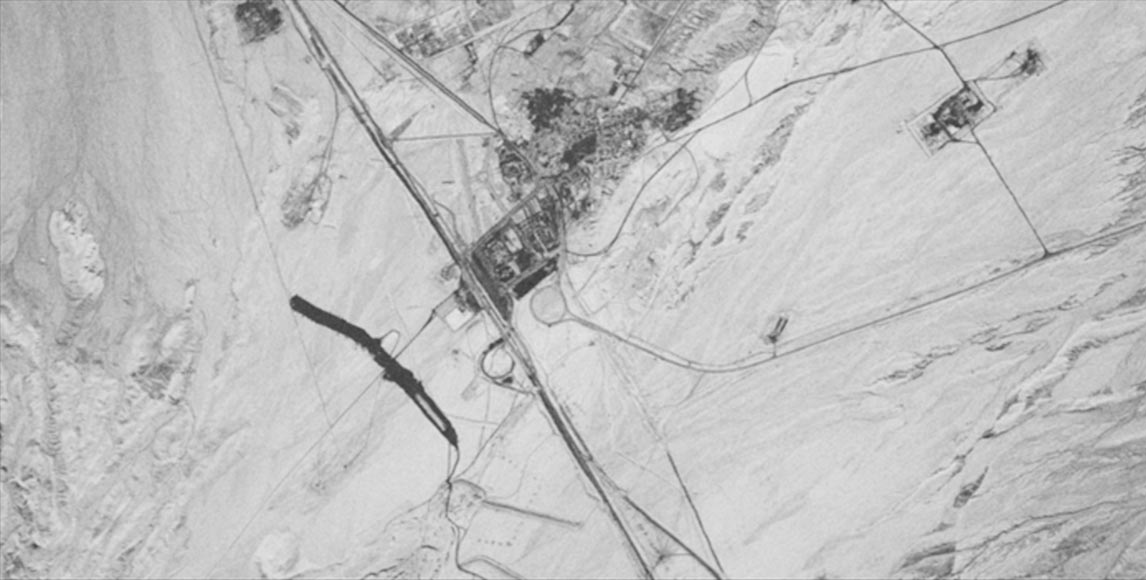
Coherence image of a village in Iran showing stable features (light grey) and highly coherent features (black) that have changed due to excavation. Source: Umbra SAR Open Data.
Radar Cross Section
In simple terms, an object's Radar Cross Section (RCS) determines how detectable it is by radar systems. It represents how much electromagnetic energy an object reflects back to a radar receiver. RCS is a valuable metric used in the defense industry, as it can indicate the detection level of enemy aircraft by radar. The SAR Radar Cross Section tool estimates the RCS of objects that you mark with polygon Regions of Interest (ROIs).
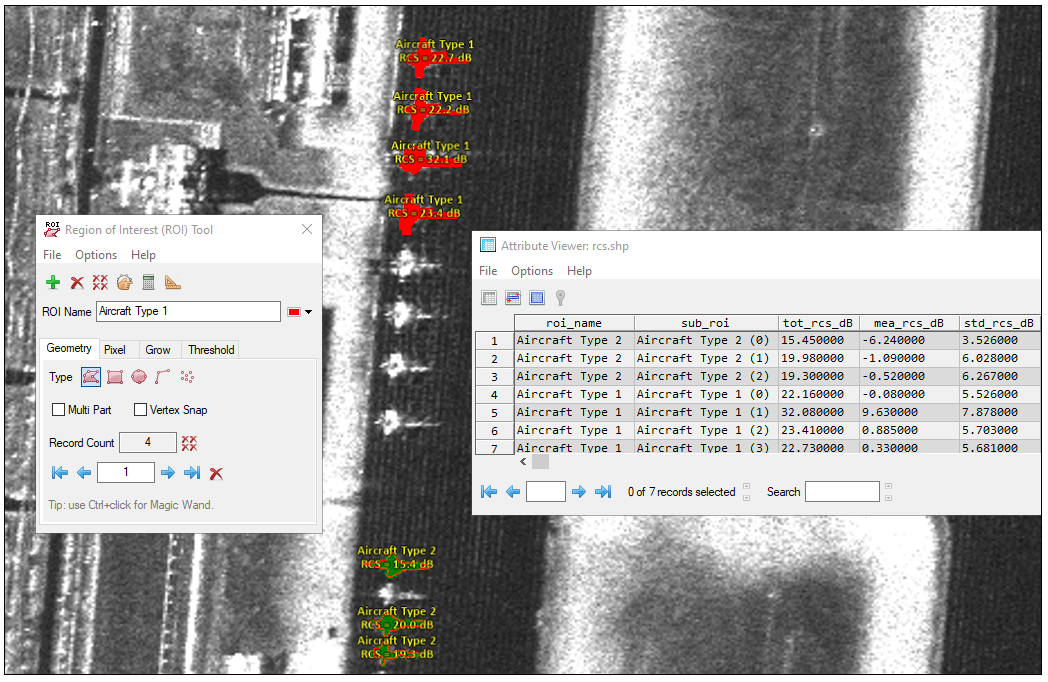
RCS measurements of different types of aircraft at a Russian air base. Source: Capella Space Open Data Gallery..
Ship Detection
The SAR Ship Detection tool uses a Constant False Alarm Rate (CFAR) algorithm to automatically detect ships in SAR images. Ship locations are compared with corresponding Automatic Identification System (AIS) records that you supply. AIS is a maritime digital positioning system developed for identification, tracking, and search-and-rescue operations for vessels. AIS messages provide information about vessels' identities, position, speed, course, and other relevant information.
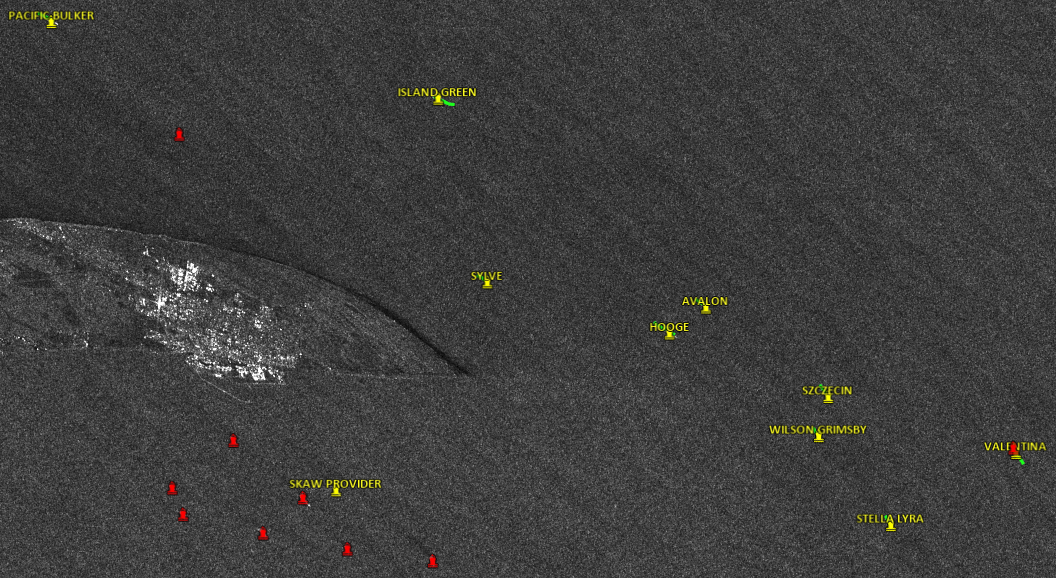
Ship detections and corresponding AIS labels near Denmark. Source: European Union, Copernicus Sentinel-1 imagery. AIS data were provided by the Danish Maritime Authority.
Summary
SAR sensors provide insights and fill in the blanks left by other sensors. ENVI SAR Essentials empowers D&I analysts with simple yet powerful workflows to maximize the value of SAR data. With ENVI SAR Essentials, analysts can detect moving objects, monitor changing environments, characterize local terrain, and create other time-sensitive products, ultimately enhancing the effectiveness and precision of operations.
To discuss how your organization can benefit from SAR data and ENVI SAR Essentials, just email us – GeospatialInfo@NV5.com.