7832
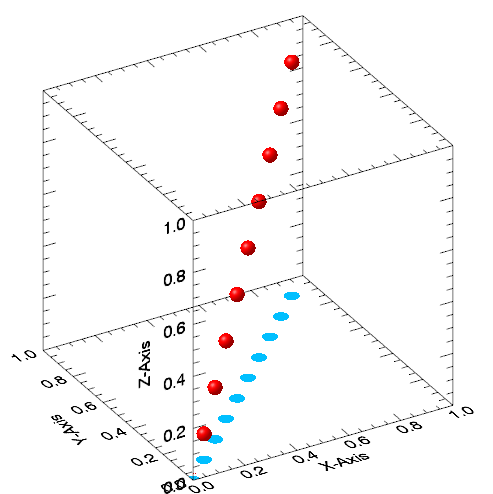
Example program with Plot3D: Spherical plot symbols with shadows
; Exelis VIS Technical Support example main level program illustrating how
; to plot spheres using the IDL docs example ORB object as the plot symbol
;
; The ORB object class is defined in the file "orb__define.pro" and is
; included in the IDL installation example files. If you would like to
; look at the object definition source file for the ORB, just type the following into the
; IDL command line:
; .edit orb__define.pro
;
; Drawing the shadows can also be done using the Plot and ScatterPlot functions
; (using the zvalue keyword)
;
; How to run:
; Save sample code as a .pro file, then compile and type ex_plot3d_orb_shadows
; into the IDL command line
;
;
; Author:
; Exelis VIS Technical Support (zn, 26-March-2015)
;
;
pro ex_plot3d_orb_shadows
compile_opt idl2
;arbitrary number of points to plot
n = 10.0
;length of x, y, and z axes
xyzmax = 1.0
;plot with spheres as symbols using ORB
p1 = PLOT3D(xyzmax/n*findgen(n), xyzmax/n*findgen(n), xyzmax/n*findgen(n), $
DIMENSIONS=[500,500], AXIS_STYLE=2, ASPECT_RATIO=1.0, ASPECT_Z=1.0, $
SYM_OBJECT = orb(), SYM_COLOR = 'red', SYM_SIZE=2.0, $
LINESTYLE="none", XTITLE='X-Axis', YTITLE='Y-Axis', ZTITLE='Z-Axis', $
XRANGE=[0.0,xyzmax], YRANGE=[0.0,xyzmax], ZRANGE=[0.0,xyzmax] )
;create a second plot with circular shadows for the spheres
;!null is used to create the plot without assigning it to a variable
;the reference handle is discarded when assigned to !null
!null = PLOT3D(xyzmax/n*findgen(n), xyzmax/n*findgen(n), 0*xyzmax/n*findgen(n),$
DIMENSIONS=[500,500], AXIS_STYLE=2, ASPECT_RATIO=1.0, ASPECT_Z=1.0, $
SYMBOL="circle", SYM_FILLED=1, SYM_COLOR='deep_sky_blue', SYM_SIZE=2.0, $
LINESTYLE="none", XRANGE=[0.0,xyzmax], YRANGE=[0.0,xyzmax], $
ZRANGE=[0.0,xyzmax], /overplot )
end
[reviewed for external by zn(3.26.2015) and ju (3.26.2015)]