16322
Finding multiple local max/min values for 2D plots with IDL
As is, IDL does not have a built in function to find multiple local maximums or minimums for 2D plots. Luckily, there is a simple algorithm that can be applied to a data set to determine if a point is a maximum or minimum. The algorithm works by checking the point to the left and to the right for the i-th point and seeing if the i-th point has a larger value than it's neighbors. If the i-th point is larger than it's neighbors, then the index gets added to a list and returned as an array at the end of the algorithm.
The algorithm also has a keyword included, /MINIMA, for finding the local minimum values. The default is to find the local maximums. In order to find the local minimums, the y-values are just multiplied by -1, which will make the local minimums into local maximums, and then the same algorithm is performed.
It should be noted that this program may not work well for data sets with lots of noise. This is because the code will extract each and every maximum or minimum that satisfy the above conditions. It is up to the user to find a proper filter or data processing method to pre-process their data.
To run the program, save the code below as local_max_finder.pro and then compile and run from the IDL Workbench. It should be noted that the program makes use of a main level program after the function definition so that you don't have to have two .pro files.
function local_max_finder, datax, datay, $
;keyword for minimum /minima
minima = minima
;set compile options
compile_opt idl2
;initialize list
max_points = list()
data_x = datax
data_y = datay
;check for keyword, flip the sign of the y values
if keyword_set(minima) then data_y = -datay
;iterate through elements
for i=1, n_elements(data_y)-2 do begin
;previous point less than i-th point and next point less than i-th point
if ( (data_y[i-1] lt data_y[i]) AND (data_y[i] gt data_y[i+1])) then max_points.add, i
endfor
;return an array of the indices where the extrema occur
return, max_points.toarray()
end
;main level program
compile_opt idl2
ireset, /no_prompt
;make some test data
xvals = findgen(2000)
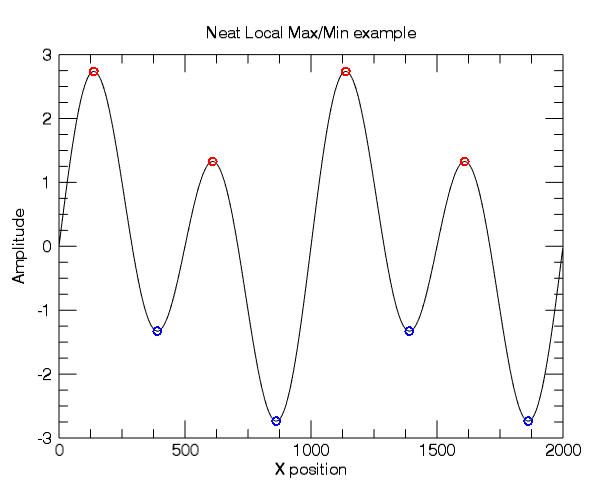
yvals = 2*sin( xvals*(2*!PI/500) ) + sin( xvals*(2*!PI/1000) )
;plot the test data
p = plot(xvals, yvals,$
xtitle = 'X position', ytitle = 'Amplitude',$
yminor = 3, xminor = 3, title = 'Neat Local Max/Min example')
;find the local max index
local_maxmin_index = local_max_finder(xvals, yvals)
;extract the x/y pairings of the local max/min
x_extrema = xvals[local_maxmin_index]
y_extrema = yvals[local_maxmin_index]
;overplot the max/min on the existing plot
p2 = scatterplot(x_extrema, y_extrema, /current, /overplot, $
symbol = 'o', sym_color = 'r', sym_thick = 2)
;find the local min index with /minima keyword
local_maxmin_index = local_max_finder(xvals, yvals, /minima)
;extract the x/y pairings of the local max/min
x_extrema = xvals[local_maxmin_index]
y_extrema = yvals[local_maxmin_index]
;overplot the min on the existing plot
p3 = scatterplot(x_extrema, y_extrema, /current, /overplot, $
symbol = 'o', sym_color = 'b', sym_thick = 2)
end
Reviewed by ZN 7/2015