7720
How to produce a plot with a linear Y axis and a logarithmic Y axis
Topic
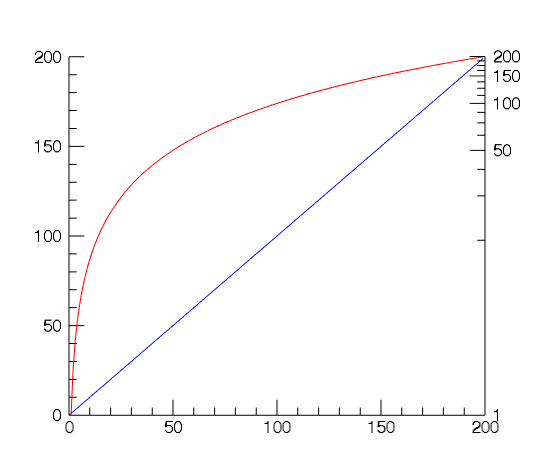
The question is how to produce a plot that has both a linear and a logarithmic Y axes.
The following code is an example of how to accomplish this in IDL using the new graphics functions.
Discussion
To be able to have two different data sets in a right and left Y axis, the user will need to setup a separate data space to draw a second overlapping plot and axis (see, TARGET=p_log below). Otherwise if a user attempts to plot in the same data space as the original plot, the log=1 keyword in AXIS() will change the original plot's data space to be logarithmic.
For more examples on plots with two data sets see the following link:
http://www.harrisgeospatial.com/docs/plot_2d.html
Here is the code to create the above plot in IDL:
;make some data
f=findgen(200)
;plot the data
p = PLOT(f, 'b', $
AXIS_STYLE = 1, $ ; make only x & y axes, not box axes
MARGIN = [0.15, 0.15, 0.20, 0.15]); leave room for bottom & right axes
;create the log plot
p_log = PLOT(f, 'r', $
/CURRENT, $
YRANGE = [1,max(f)], $
AXIS_STYLE = 0, $ ; no axes
MARGIN = [0.15, 0.15, 0.20, 0.15]) ; need to use the same margin as above
;make the log axis for the y direction
logy = AXIS('y', $
TARGET = p_log, $
LOCATION = [max(p_log.xrange),0,0], $ ; right y-axis, data coordinates
TEXTPOS = 1, $ ;text on the outside
log = 1,$ ; specify the log scale
tickdir = 1);have the ticks on the inside of the plot
;manipulate the locations/labels of the resulting axis
;using the first axis so that the axes have the same labels
first_yaxis=(p.axes)[1]
logy.major= n_elements(first_yaxis.tickvalues)
names=logy.tickvalues
names[1:*]=(first_yaxis.tickvalues)[1:*]
logy.tickvalues=names
logy.minor = 3
Reviewed by ZN (1-July-2015), JU (1-July-2015)