Rethinking the Reliability of Type 1a Supernovae
How do astronomers measure the universe? It all starts with distance.
From gauging the size of a galaxy to calculating how fast the universe is expanding, measuring cosmic distances is essential to understanding everything in the sky. For nearby stars, astronomers use parallax—the subtle “wiggle” in a star’s position as Earth orbits the Sun. But when it comes to distant galaxies, they rely on some of the brightest explosions in the cosmos: Type 1a supernovae (SN 1a). These powerful events are considered reliable “standard candles,” cosmic yardsticks that are assumed to shine with a constant brightness.
But what if that assumption isn’t entirely accurate?
A new study by Professor Yen-Chen Pan, at the Graduate Institute of Astronomy, National Central University, Taiwan, challenges this idea. His research reveals that not all Type 1a Supernovae behave the same, and that their differences may affect how we measure vast cosmic distances and even understand the expansion of the universe.
A Quick Primer on Supernovae and Standard Candles
A Type 1a supernova occurs when a white dwarf (the dense core of a dead star) accumulates too much material from a nearby star and can’t handle the extra mass. When it reaches a tipping point, it erupts in a brilliant explosion. These explosions are incredibly bright and were long thought to follow a predictable pattern, making them perfect tools for measuring how far away they are, like using a 100-watt lightbulb to gauge distance based on how dim it appears.
This assumption has helped astronomers build the “cosmic distance ladder,” a framework that lets them measure distances from nearby starts to the edge of the observable universe. For distant galaxies, SNe 1a are often the only beacons bright enough to see.
What Makes Type 1a Supernova a Type 1a?
The label comes from how astronomers classify exploding stars by their spectral fingerprint. If a supernova’s spectrum lacks hydrogen, the most common element in the universe, it is labeled a Type 1. If it also shows a signature of silicon, it becomes Type 1a.
Historically, astronomers believed all SNe 1a behaved similarly, especially in how they brightened and faded over time. But if subtypes exist within this category, that could dramatically alter our distance calculations, and by extension, our models of the universe’s size, age, and fate.
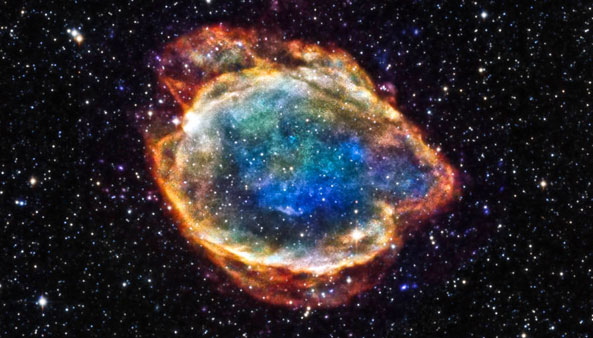
Type Ia supernova. Image courtesy of Wikipedia.
Pan’s Research: Not All Type 1a Supernovae Are the Same
In his study “Exploring the Origins and Cosmological Impact of Type 1a Supernovae with Their Ejecta Velocities,” Professor Pan analyzed hundreds of SNe 1a using NV5’s IDL® software. His findings were eye-opening. SNe 1a appear to fall into two distinct categories based on how fast their stellar debris (ejecta) travels—high-velocity (HV) and normal-velocity (NV) types.
These subtypes show up in different types of galaxies and may originate from different environments, suggesting multiple formation paths. Even more compelling, the mix of HV to NV SNe 1a appears to shift over cosmic time. That means older and younger parts of the universe may contain portions of each type, potentially skewing our measurements.
The Power of IDL in Unlocking Insights
To analyze such a large dataset, Pan turned to IDL, a high-performance programming language built for scientific data analysis and visualization. IDL made it possible to extract key features from the optical spectra of hundreds of supernovae quickly and accurately.
“The data reduction of such a large dataset with IDL is particularly fast and efficient. The whole analysis can be done within minutes for hundreds of SN spectra.”
- Professor Yen-Chen Pan
With IDL's flexibility and commercial updates, Pan performed everything from spectral line fitting to statistical modeling. The result? Reproducible high-quality insights that are reshaping how we think about SNe la.
Digging Into the Results
Pan’s focused on a specific absorption feature, (Si II λ6355), to measure the speed of the supernova ejecta. Past studies already hinted that HV and NV supernovae differ in several ways, including where they’re located in their host galaxies and how they interact with surrounding dust.
Pan expanded this research, finding that:
This strongly suggests multiple evolutionary paths for SN 1a, an insight that could shake the foundation of how we use them to measure the cosmos. Even more striking, Pan found that HV SNe 1a becomes less common at higher redshifts (father back in time). That evolutionary shift has major implications for using SNe 1a as cosmic distance markers, especially in studies of dark energy.
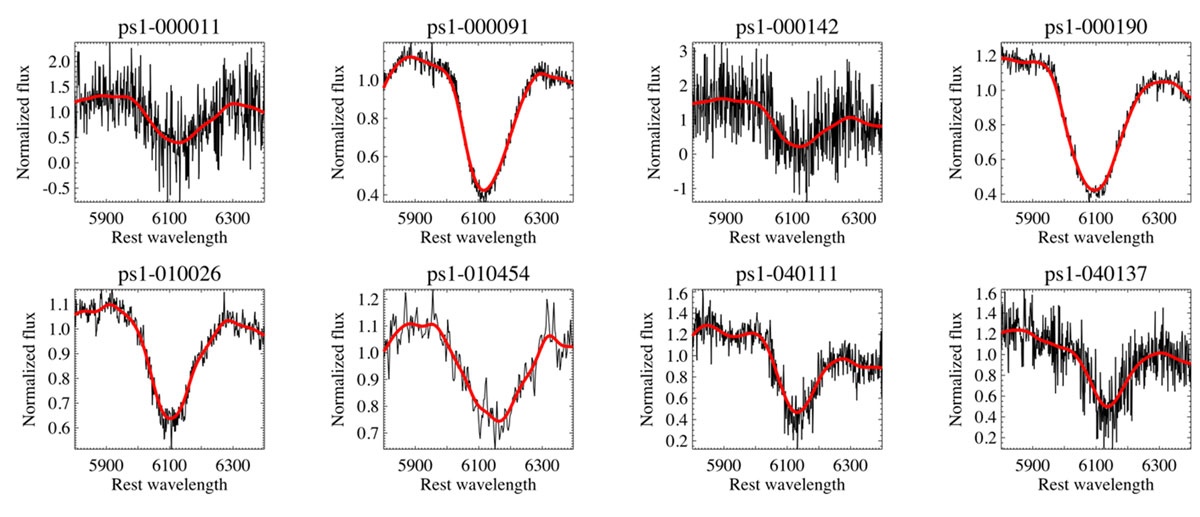
Figure 1. Some examples of the Si II λ6355 absorption feature of SNe 1a measured using IDL. The observed and smoothed spectra are shown in black and red, respectively. The SN ejecta velocity is measured by the blue-shifted wavelength of the absorption minimum relative to the rest-frame wavelength of the spectral line.
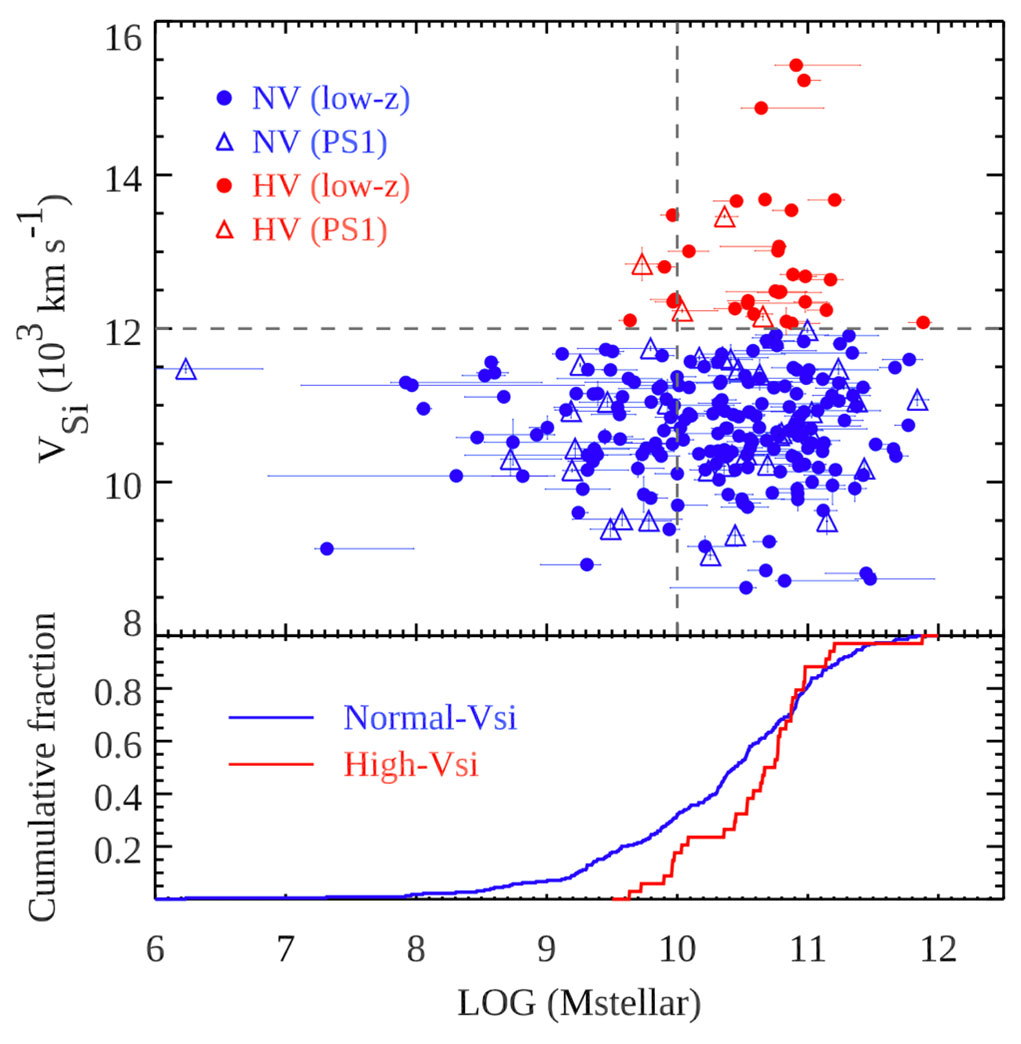
Figure 2. The Si II λ6355 velocities as a function of host-galaxy stellar mass of SNe 1a. The high-redshift and low-redshift SN samples are represented by open triangles and solid circles, respectively. The HV SNe are shown in red and NV SNe are shown in blue. There is a clear trend that HV SNe 1a tend to be found in more massive galaxies while no such preference is found for NV SNe 1a.
Why This Matters to Everyone
Understanding how far away things are isn’t just an academic exercise. It directly affects how we measure the universe’s expansion, how we understand dark energy, and how we model the cosmos. If SNe 1a are more diverse than previously thought, then the tools we use to measure the universe need to evolve too.
Thanks to powerful tools like IDL and researchers like Professor Pan, we’re getting a clearer and more accurate picture of the universe. His work helps ensure that our cosmic yardsticks are properly calibrated, opening the door to more precise models of space, time, and everything in between.
In Summary
In summary, this isn’t just about classifying supernovae. It’s about refining the tools we use to understand the universe and possibly rethinking some of our biggest assumptions about its structure and origin. With tools like IDL and research like Pan’s, we’re not just mapping the stars, we’re redefining how we measure the universe itself.