6217
Plotting the globe 360 degrees from an arbitrary starting point
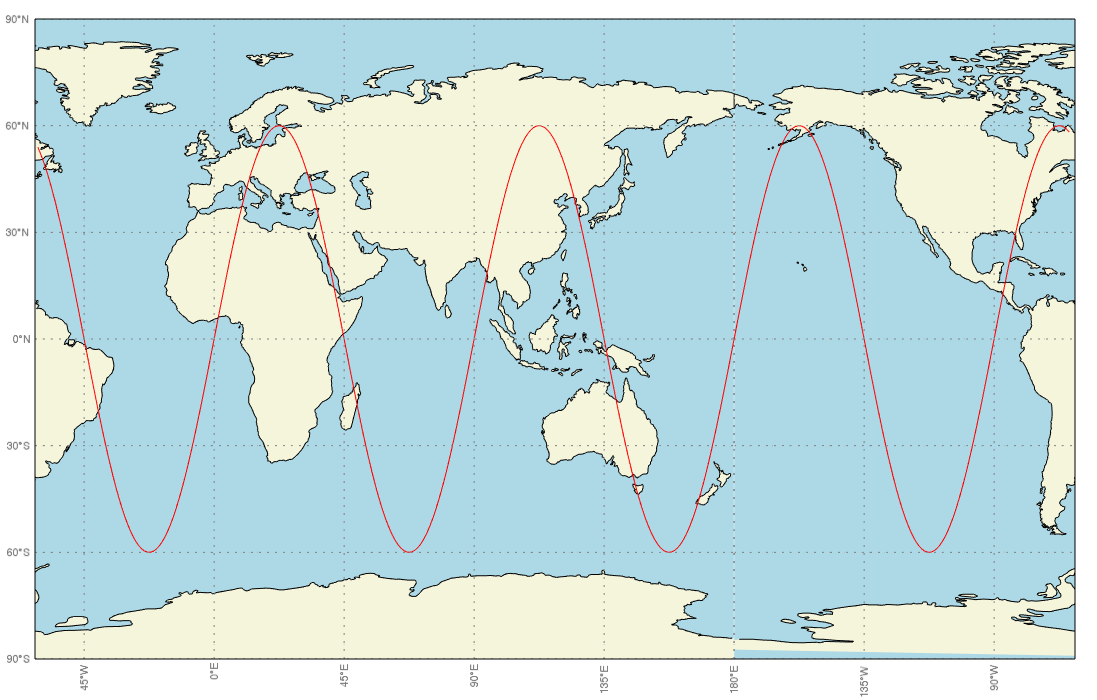
One of the really nice things about IDL's function graphics is that you have the ability to go crazy customizing plots and maps to make some cool visualizations. This help article is meant to be a longer example example for how this can be done with two maps. For this case, we are plotting the globe a full 360 degrees from an arbitrary starting point. This can be useful because the standard map in IDL is limited to +/- 180 degrees and data spaces get strange if you try to go beyond those limits.
To get around this, one map is split up into two separate maps. The first map goes from the starting longitude to 180 degrees West, while the second map goes from 180 degrees East to the starting longitude. In addition to just making maps, the code below is set up to also overplot data into these data spaces. If you want to plot data, you must use the keywords XDATA and YDATA for the longitude and latitude data points. If you are plotting all the way around the globe, you must have XDATA extend 360 degrees past the starting point. In other words, if we start at -90 degrees the final longitude should be 270 degrees.
To recreate the map above, save the code below as as 'full_world_map.pro' and type the following line into the IDL console:
projection = 'equirectangular'
lonstart = -62.
npoints = 360
;make some data to overplot
x = findgen(npoints, START=lonstart, increment = 360./(npoints+1))
y = 60*sin(x*(2*!PI/90.))
full_world_map, projection, lonstart, XDATA = x, YDATA = y
The number -62 corresponds to the starting longitude where the globe will be plotted 360 degrees clockwise from.The starting longitude should fall between -180 and 180 degrees. The different projection names that have been tested are: 'geographic', 'mercator', 'equirectangular', 'cylindrical', 'cylindrical equal area', and 'miller cylindrical'.
Here is the program code:
pro full_world_map, projection, lonstart, XDATA = xdata, YDATA = ydata
compile_opt idl2
ireset, /no_prompt
plot_color = 'red'
plot_thickness = 1.0
latrange = [-90.,90.]
;specify the degrees between each label on the map
lonlabelspacing = 45
latlabelspacing = 30
;specify the longitude range for the first map
lonrange_map1 = [lonstart, 180.]
;specify the longitude range for the second map
lonrange_map2 = [-180., lonstart]
;check against a list of maps that need 0 for center longitude
badmaps = ['geographic']
if (total(projection eq badmaps) ge 1) then begin
center_longitude1 = 0
center_longitude2 = 0
endif else begin
center_longitude1 = .5*total(lonrange_map1)
center_longitude2 = .5*total(lonrange_map2)
endelse
;find the correct positions for the maps within the window
maprange = [.1,.9]
ratio_of_maprange = (lonrange_map1[1]-lonrange_map1[0])/360.
pos_map1 = [maprange[0],maprange[0],$ ; X1, Y1
maprange[0] + ratio_of_maprange*(maprange[1] - maprange[0]),maprange[1]]; X2, Y2
pos_map2=[(ratio_of_maprange)*(maprange[1]-maprange[0])+maprange[0] ,maprange[0],$; X1,Y1
maprange[1], maprange[1]] ; X2, Y2
;create our plot window
w1 = window(window_title = 'Super Neat Globe Example',dimensions = [1300,800])
w1.refresh, /disable
;draw the first portion of the map
Map1 = MAP( projection, FILL_COLOR='Light Blue', COLOR='Gray', $
LIMIT= [latrange[0], lonrange_map1[0], latrange[1], lonrange_map1[1] ], $
LINESTYLE='Dotted', LABEL_POSITION=0, position = pos_map1,$
center_longitude = center_longitude1, /current,$
GRID_LONGITUDE = lonlabelspacing, GRID_LATITUDE = latlabelspacing)
Map1.position = pos_map1 ;need to set this again for it to be set sometimes
;plot the continents
mc = MAPCONTINENTS(/continents, FILL_COLOR='beige',/noclip)
;if we have data specified to overplot
if keyword_set(xdata) AND keyword_set(xdata) then begin
;if we only have one map, then only one call to plot is needed
if (floor(lonrange_map1[1] - lonrange_map1[0]) eq 360) then begin
p1 = plot(xdata, ydata, current = map1, /overplot, $
color = plot_color, THICK = plot_thickness)
endif else begin
;separate data that goes to map 1 and map2
map1_indices = where((xdata gt lonstart) AND (xdata lt 180.))
p1 = plot(xdata[map1_indices], ydata[map1_indices], current = map1, $
/overplot, clip = 0, color = plot_color, thick = plot_thickness)
endelse
endif
;draw the other part of the globe if the first plot does not extend 360 degrees
if (floor(lonrange_map1[1] - lonrange_map1[0]) ne 360) then begin
map2 = MAP( projection, FILL_COLOR='Light Blue', COLOR='Gray', $
LIMIT=[ latrange[0], lonrange_map2[0], latrange[1], lonrange_map2[1] ], $
LINESTYLE='Dotted', LABEL_POSITION=0, position = pos_map2, $
center_longitude = center_longitude2, /current,$
GRID_LONGITUDE = lonlabelspacing, GRID_LATITUDE = latlabelspacing)
map2.position = pos_map2 ;need to set this again for it to be set sometimes
;plot the continents
mc = MAPCONTINENTS(/continents, FILL_COLOR='beige',/noclip)
;hide the necessary labels
Map2_grid = Map2.mapgrid
Map2_lats = Map2_grid.latitudes
Map2_lons = Map2_grid.longitudes
for i = 0, n_elements(Map2_lats)-1 do Map2_lats[i].label_show = 0
Map2_lons[0].label_show = 0
endif
;map1 and map2 positions
actual_pos1 = map1.position
;get position of map2 if it exists
if (map2 eq !NULL) then actual_pos2 = actual_pos1 else actual_pos2 = map2.position
;draw a box around the overall map
border = polygon([actual_pos1[0],actual_pos2[2],actual_pos2[2],actual_pos1[0]],$
[actual_pos1[1],actual_pos1[1],actual_pos1[3],actual_pos1[3]],$
fill_background = 0,'black')
;if we have data specified to overplot
if (keyword_set(xdata) AND keyword_set(xdata)) then begin
;if we only have one map, then only one call to plot is needed
if (map2 ne !NULL) then begin
;separate data that goes to map 1 and map2
map2_indices = where((xdata lt lonstart) OR (xdata gt 180.))
p2 = plot(xdata[map2_indices]-360, ydata[map2_indices], current = map2,$
/overplot, color = plot_color, thick = plot_thickness)
;add a polyline to the window so that we have connected plots, find closest
;data values to 180 degrees west
point1=[max(xdata[map1_indices]), ydata[where(xdata eq max(xdata[map1_indices]))]]
point2=[min(xdata[map2_indices])-360,ydata[where(xdata eq min(xdata[map2_indices]))]]
;convert locations to normalized coordinates after converting to cartesian X-Y
pixelpoint1 = map1.convertcoord(map1.mapforward(point1), /DATA, /TO_NORMAL)
pixelpoint2 = map2.convertcoord(map2.mapforward(point2), /DATA, /TO_NORMAL)
;make line between the two end points
line = polyline([pixelpoint1[0], pixelpoint2[0]], [pixelpoint1[1], pixelpoint2[1]], $
/DEVICE, target = w1, color = plot_color, thick = plot_thickness)
line.position = [pixelpoint1[0], pixelpoint1[1], pixelpoint2[0], pixelpoint2[1]]
endif
endif
;refresh the overall plot and make window current
w1.refresh
end
Reviewed by ZN (1-July-2015), JU (1-July-2015)