4691
Adding user-defined plotting symbols to ENVI for vector point coverages
ENVI provides 9 different plotting symbols that you can use to display vector point coverages (for example squares, triangles, plus signs, etc.). You can easily add to this list by defining your own plotting symbols.
In ENVI's
menu directory (which is under the main ENVI directory), you will find the file usersym.txt. This file contains all of the user defined plot symbols. One symbol definition is provided as an example, the Flag symbol (the other 8 symbols are built-in):
Flag = {0, .1, 0, 1.5625, .725, 1.25, 0, .9375, 0, 1.0625, .44, 1.25, 0, 1.4375}
The symbols are vector-drawn and the points that define the symbol (as a polyline or polygon) are simply listed in order as (x,y) pairs, separated by commas, and enclosed in curly brackets:
user_symbol = { x1, y1, x2, y2, x3, y3, ... xn , yn }
The vector points do not need to be normalized to one. For example, here is the definition for a star symbol that was defined by freehand drawing a star over a 5x5 cell grid:
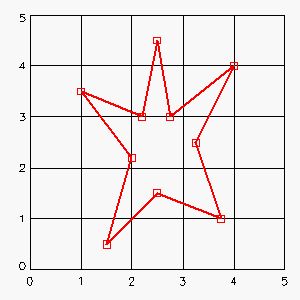
star ={1.5, 0.5, 2, 2.2, 1, 3.5, 2.2, 3, 2.5, 4.5, 2.75, 3, 4, 4, 3.25,
2.5, 3.75, 1, 2.5, 1.5, 1.5, 0.5}
The first point is (1.5, 0.5), the second point (2, 2.2), etc. Also, you can have line breaks at any point on the line that defines the symbol. For example, the following definition for the star would also work:
star = {
1.50, 0.50,
2.00, 2.20,
1.00, 3.50,
2.20, 3.00,
2.50, 4.50,
2.75, 3.00,
4.00, 4.00,
3.25, 2.50,
3.75, 1.00,
2.50, 1.50,
1.50, 0.50
}
After you have edited the
usersym.txt file, remember to save it and restart ENVI, then your new symbols should appear as options when you edit a vector layer.