5554
IDL Graphics Categories
Topic
This article is a quick discussion of the different categories of graphics that are included in IDL.
NOTE: Though this article discusses the various graphics categories that are included in IDL. However, for the most part, only the IDL 8 Graphics and Object Graphics are being actively developed.
Discussion
IDL is a program that is designed to help user visualize data. Throughout the history of the product many tools have been made available to help users achieve. This article give a brief overview and history of some of the graphic features that have been added to IDL through the years.
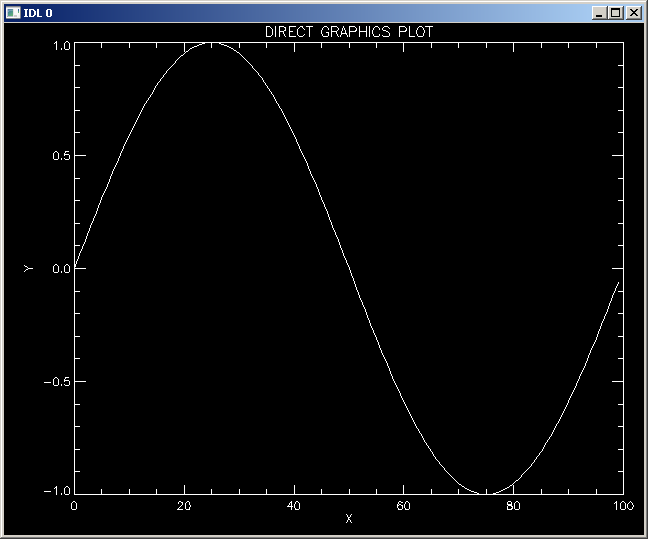
Direct Graphics
Direct Graphics are the set of graphics routines that were released with the original version of IDL (1.0 1977). Direct Graphics are fast and easy to use. They are good for producing line plots and displaying images. Some of the limitations of Direct Graphics are that they are non-interactive, difficult to output to a file (while may be of lower quality) and may look a little dated. Direct Graphics are called using procedures, for example:
;create the data that is to be plotted
x = findgen(100)
y = sin(x*2*!pi/100)
;create the direct graphics plot
plot, x, y, xtitle='X', ytitle="Y", $
title="DIRECT GRAPHICS PLOT"
If you have inherited some legacy code, it is most likely going to use Direct Graphics. More information about the Direct Graphics can be found in the IDL help:
http://harrisgeospatial.com/docs/Direct_Graphics.html
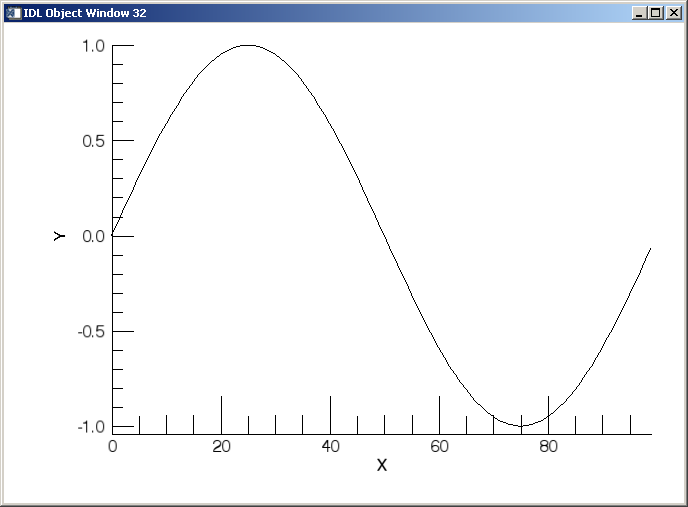
Object Graphics
Object Graphics are a set of IDL objects that allow users to create OpenGL based graphics from IDL. The Object Graphics were added in IDL 5.0 (1997) and can be used to create high quality 2D/3D images. It can be easier to output the contents of an Object Graphic to a file than a Direct Graphic. The limitations of Object Graphics is that they require some understanding of object oriented programming and can require a lot of code. For example, the program below generates a single plot:
;create the data that is to be plotted
x = findgen(100)
y = sin(x*2*!pi/100)
;Create Object Graphic version of the plot
;(NOTICE: much longer than other sections)
omodel= OBJ_NEW('IDLgrModel') ;create new model
oplot = OBJ_NEW('IDLgrPlot',x, y, /DEPTH_TEST_DISABLE)
oplot->GetProperty, XRANGE=xr, YRANGE=yr
oTextXAxis = OBJ_NEW('IDLgrText', 'X')
oPlotXAxis = OBJ_NEW('IDLgrAxis', 0, /EXACT, RANGE = xr,$
TITLE = oTextXAxis, LOCATION = [xr[0],$
yr[0]-.04], TICKDIR = 0)
; Y-axis title.
oTextYAxis = OBJ_NEW('IDLgrText', 'Y')
; Y-axis.
oPlotYAxis = OBJ_NEW('IDLgrAxis', 1, /EXACT, RANGE = yr, $
TITLE = oTextYAxis, $
LOCATION = [xr[0], yr[0]], TICKDIR = 0, TICKLEN=4)
;Create a veiwplane rectangle to enclose the data
xmin = min(x, max=xmax)
ymin = min(y, max=ymax)
width = xmax - xmin
height = ymax - ymin
xpad = 0.2*width
ypad = 0.2*height
vr=[xmin-xpad, ymin-ypad, width+1.3*xpad, height+1.3*ypad]
oview = obj_new('IDLgrView', viewplane_rect=vr)
omodel->add, oPlotXAxis ;x axis
omodel->add, oPlotYAxis
omodel->add, oplot
;Add the model to the view
oview->add, omodel
;make a window to see the OGH then draw the OGH to the window
owindow = obj_new('idlgrwindow',retain=2,$
graphics_tree=oview,$
DIMENSIONS=[680,480])
owindow->draw
More information about the Object Graphics can be found in the IDL documentation:
http://harrisgeospatial.com/docs/Overview_of_Object_Graph.html
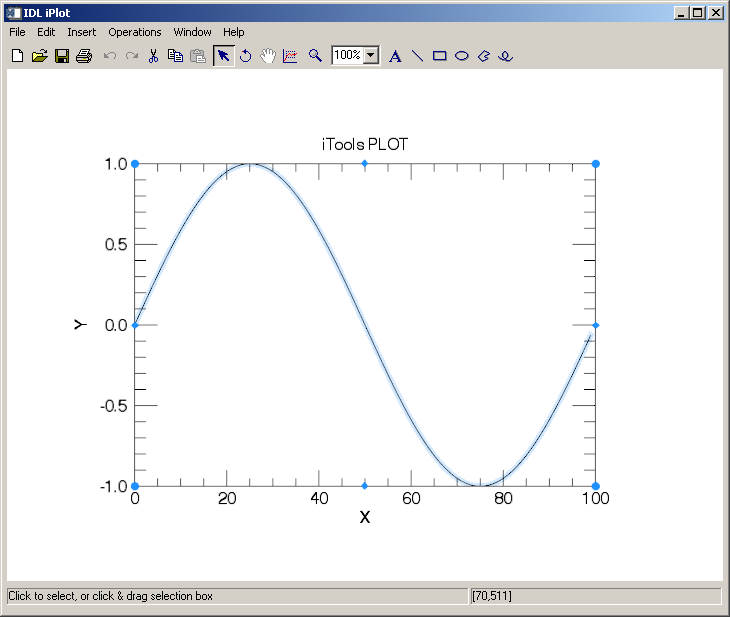
iTools
iTools are a set of routines that allow users to generate Object Graphic images more easily. iTools is also a framework for object graphics that allows users to develop their own tools. iTools are interactive and it is easy to save output from them.The limitations of iTools are that they are difficult to script and the framework can be opaque and therefore hard for users to develop.
An example iTool plot is shown below:
;create the data that is to be plotted
x = findgen(100)
y = sin(x*2*!pi/100)
;create the itools plot
iplot, x, y, xtitle='X', YTITLE='Y', TITLE="iTools PLOT"
More information about this can be found iTools can be found in the documentation:
http://harrisgeospatial.com/docs/iTools.html
http://harrisgeospatial.com/docs/pdf/itooluserguide.pdf
http://harrisgeospatial.com/docs/pdf/itooldevguide.pdf
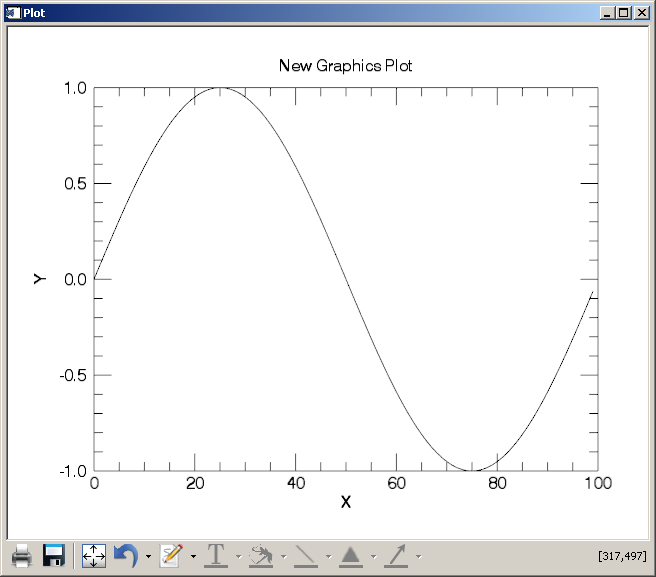
IDL 8 Graphics
The IDL 8 Graphics were released in IDL 8.0 (2010). In forums and blogs they are sometime referred to as New Graphics or Function Graphics. The IDL 8 Graphics are high level routines that allow users to generate iTools based images. They are designed to be as easy to use as Direct Graphics, have the visual quality of Object Graphics/iTools and to be interactive like iTools. They are easy to include in IDL scripts and it easy to save the output to files. The limitations of IDL 8 Graphics is that they are relativly new so you may encounter bugs, and they can sometimes be slow for larger data sets (though both these limitations improve a lot in recent releases). IDL 8 Graphic are called using functions. An example of a plot generated using IDL 8 Graphics is shown below:
;create the data that is to be plotted
x = findgen(100)
y = sin(x*2*!pi/100)
;create the new graphics plot
p=plot(x,y,XTITLE='X', YTITLE='Y', $
TITLE="New Graphics Plot")
A list of the Graphics routines can be found using the link below:
http://harrisgeospatial.com/docs/visualize.html
http://harrisgeospatial.com/docs/Graphics.html
Written by DS and reviewed by JU (9/11/2014)