Bring DEMs to Life with the Topographic Shading Tool
A digital elevation model (DEM) contains a wealth of information about the terrain in a given area; however, the DEM itself can look pretty boring and it's difficult to see and extract the information contained in it. Now you can bring out the details of the terrain from a DEM in colorful and eye-catching ways.
This article provides some compelling examples of topographic images created from a DEM using the new Topographic Shading Tool, which will be available in the next release of ENVI in late summer of 2018. For illustration, I use a U.S. Geological Survey 1/9-arc-second DEM of the Appalachian mountains in Pennsylvania, USA. I also show how you can use the ENVI Modeler to create custom topographic effects such as multi-directional hillshading.
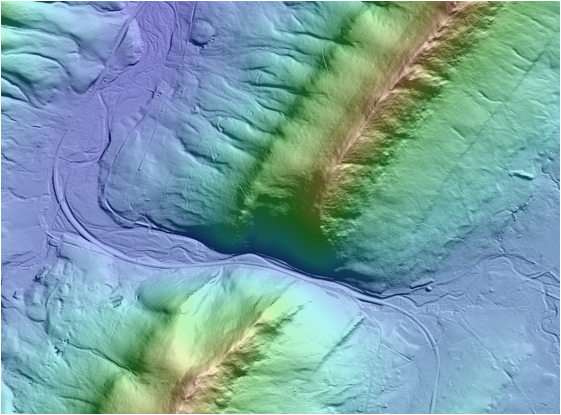
Color-blended hillshade image of a subset of the Appalachian DEM at 1/9-arc-second resolution. This level of resolution, combined with unique illumination angles, makes it easy to identify roads, trails, and streams. Lower elevations are colored blue and green, and higher elevations are colored yellow and red.
Overview
With the Topographic Shading Tool, you can blend a topographic feature image with a color ramp, using only a DEM as input. The most common topographic feature is shaded relief, or a hillshade image, as shown in the example above. You can adjust different settings to create an image that best emphasizes features in the terrain that you are interested in. Here are some of the settings you can control:
- In addition to shaded relief, you can choose other topographic features to blend with a DEM. These include slope, aspect, profile convexity, plan convexity, longitudinal convexity, cross-sectional convexity, maximum curvature, and minimum curvature.
- Choose a predefined color ramp, or create your own and save it for later use. You can also select whether the color ramp is based on a red/green/blue (RGB), hue/lightness/saturation (HLS), or hue/saturation/value (HSV) color model.
- Set the level of blending between the topographic feature and RGB color ramp. A lower blend level emphasizes more of the topographic feature, while a higher blend level emphasizes more of the colored DEM.
- Adjust the histograms of the topographic feature and DEM.
- Set the level of smoothing, using the Kernel parameter.
- For shaded relief, adjust the illumination conditions by setting Azimuth and Elevation values.
A preview window shows the real-time result as you adjust the settings. Once the previewed image looks reasonable, you can save the result to an ENVI image at the same resolution as the input DEM.
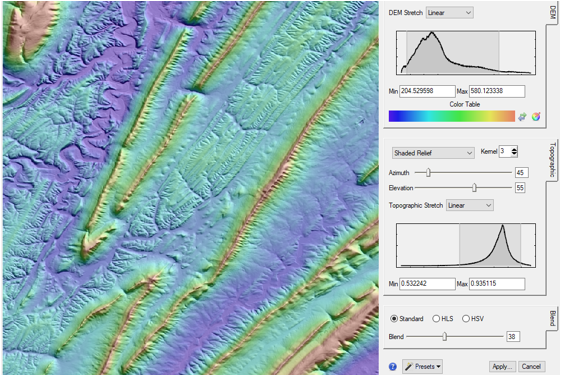
Screen capture of the Topographic Shading Tool showing a previewed shaded relief image of the Appalachian DEM, along with the various settings.
While hillshade images are the most common way to visualize terrain features from a DEM, other types of topographic images can be created and used for different purposes.
Blended Slope Image
A slope image provides a visual analysis of areas that are characterized by steep and flat terrain. While the Topographic Features tool already can create grayscale slope images (in degrees and percent), the Topographic Shading Tool can create a better visual representation of slope by blending in different color ramps and color models. The example below is a slope image that shows flat areas in white/blue/purple and steep areas in green/yellow/red. To achieve this effect, I used a HLS color model for the DEM instead of the default RGB color model. The HLS and HSV models create highlights and shadows and give the blended image a glossy or "wet" effect. I applied a Gaussian stretch to the slope image, which makes the rivers and streams stand out in white.
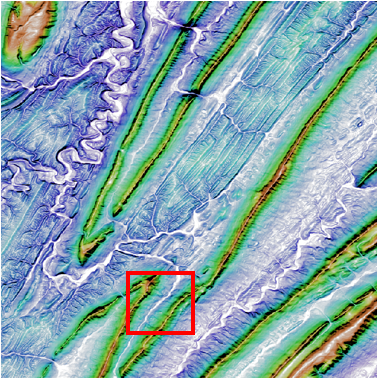
Preview of blended slope image derived from the full Appalachian DEM. The white stripe along the southeast ridge line does not represent a flat surface; this is a highlight created by the HLS color model.
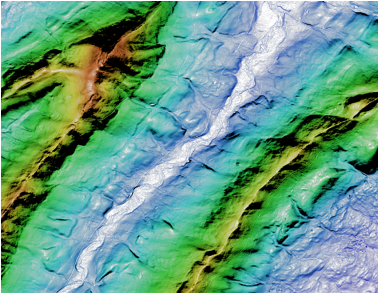
Blended slope image at full (1:1) resolution for the area indicated in the red box.
So far, these topographic images have been created using a single reference angle in which the sun illuminates the surface. It's also possible to simulate multiple illumination angles.
Multi-directional Hillshade Image
A blended hillshade image created with the Topographic Shading Tool simulates solar illumination from one direction. While you can set the azimuth angle to any compass direction, the output image represents illumination in that direction only. Areas that are not illuminated are cast in shadows, which obscures the details in the underlying relief. The following images show hillshade images created from specific azimuth values.
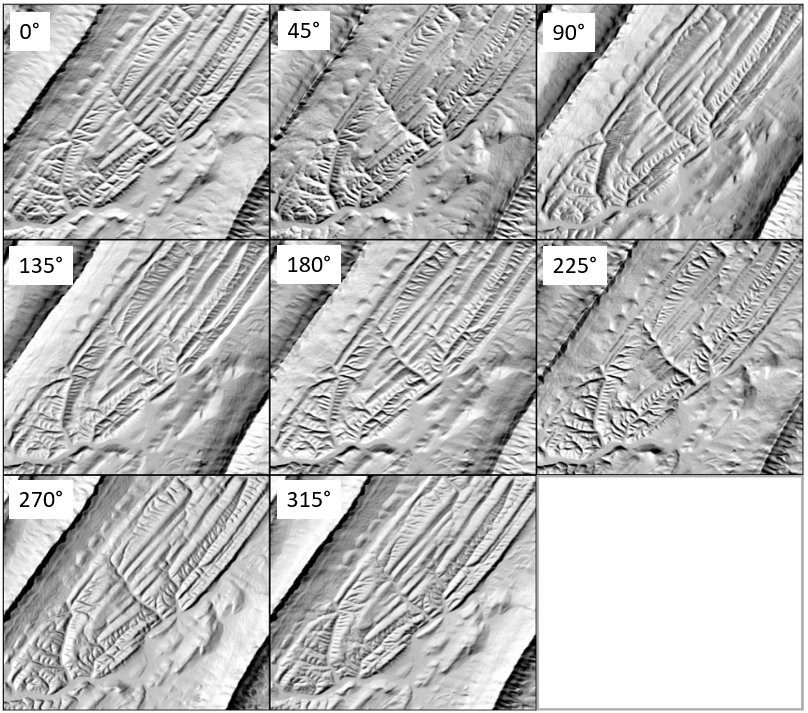
Hillshade images of an Appalachian DEM subset, created using azimuth values that are 45º apart, all with 60º elevation.
The concept of a multi-directional hillshade image has been around for several years. This type of image displays the shape of the terrain without being constrained to a specific solar viewing angle. You can easily create a multi-directional hillshade image in ENVI by building a simple model that includes using Topographic Shading functionality.
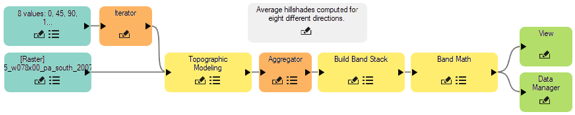
Multi-directional hillshade model created with the ENVI Modeler.
This model runs the Topographic Modeling API task eight times, each with a different numeric Azimuth value: 0º, 45º, 90º, 135º, 180º, 225º, 270º, and 315º. It creates a band stack with the eight hillshade images, then averages them using a Band Math computation: (b1+b2+b3+b4+b5+b6+b7+b8)/8.0. The result is a hillshade image where the solar azimuth is averaged over eight different directions. Below are some examples that compare single-directional to multi-directional hillshade images of the same geographic area. Notice how the multi-directional hillshade image reveals more detail in the terrain, in both flat and steep areas. The lighter contrast also makes it suitable for use as a base map or other presentation.
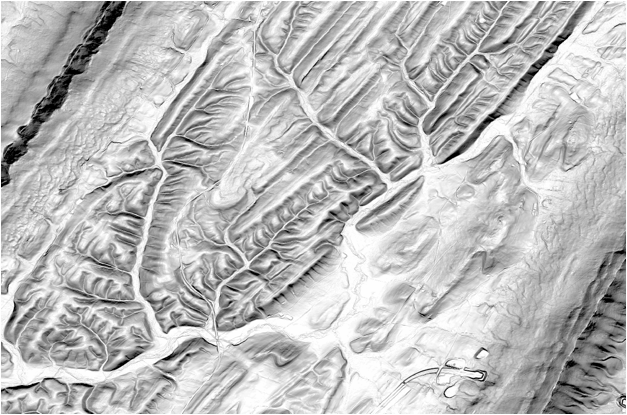
Multi-directional hillshade image of the Appalachian DEM subset, 45º elevation, Gaussian stretch applied.
The Topographic Shading tool provides an easy way to create topographic images that highlight features of interest in the terrain. Combining this tool with other ENVI analytics can yield even more powerful and effective visual presentations. Here are some ideas to consider:
- If you have point-cloud data, use the ENVI LiDAR application to create digital surface models (DSMs) and DEMs for input into the Topographic Shading Tool. You can also use raster bathymetry or magnetic anomaly data.
- Modify the multi-directional hillshade model to use any number of azimuth and elevation angles.
- Add tasks to the model that color the multi-directional hillshade image.
- Save the model as a custom tool that you can run from the ENVI Toolbox.
- Create a model that computes viewshed analysis from any given point, then overlay the viewshed result on a topographic image.
I hope you find this new tool fun and easy to work with, as I have!