Calling the R Statistical Package from IDL via Python
The R scripting language is a powerful utility for data analysis and statistics, with a wide variety of built-in graphics output types for specific input problem sets and output solutions.
Customers have frequently requested that we include in IDL a mechanism to access R because the two languages are in many ways complementary.
With the introduction of the Python bridge in IDL 8.5, we have access to the plumbing necessary to call R from IDL, through rpy2, and to exchange data between IDL and R.
Installation
The information in this blog is static and likely to remain unchanged after publication. But the installation requirements may change over time. The best advice I have to offer is to return to the R and rpy2 repositories for the most current information on best practices of joining R with Python. Once Python and R can speak with each other, it's just a hop, skip, and jump to IDL.
Linux
The author of this blog ruefully admits a lack of time and resources to attempt an installation on Linux, though the description below for Windows and a visit or two to FAQs and the stackoverflow website will likely answer any questions.
Windows
The first assumption is that you have installed and configured some version of Python as described in the IDL Python Bridge documentation.
Next, install the version of R appropriate to your platform, 32-bit vs. 64-bit, etc. The instructions for installation were found here at the time of this blog's posting. If the link is stale, search for "R scripting language download" in your favorite search engine.
After installing R, some system environment variables need to be defined in order for the rpy2 bridge to install properly on Windows. This was true as of R version 3.2.3 and rpy2 version 2.7.6.
- Add the platform-specific installation directory to your PATH environment variable, for example C:\Program Files\R\R-X.Y.Z\bin\x64
- Create a new R_HOME environment variable that points to the R-"version" directory, for example C:\Program Files\R\R-X.Y.Z
- Create a new R_USER environment variable with your Windows username
On Windows, you have the option of building the rpy2 bridge from scratch if you have the appropriate tools.
Alternatively, you can search for repositories containing pre-compiled binaries. One such repository, that includes rpy2 among many Python utilities, is found here. If the link is stale, search for the term "rpy2 windows binaries download".
It is important to download the version of the rpy2 bridge that's appropriate to your version of R and Python. From a Python prompt or the IDL Python bridge, enter
>>> import pip
>>> print(pip.pep425tags.get_supported())
Search for the highest "cp" version. In my case, this as "cp34".
[('cp34', 'none', 'win_amd64'), ('py3', 'none', 'win_amd64'), ('cp34', 'none', '
any'), ('cp3', 'none', 'any'), ('cp33', 'none', 'any'), ('cp32', 'none', 'any'),
('cp31', 'none', 'any'), ('cp30', 'none', 'any'), ('py34', 'none', 'any'), ('py
3', 'none', 'any'), ('py33', 'none', 'any'), ('py32', 'none', 'any'), ('py31', '
none', 'any'), ('py30', 'none', 'any')]
Compare this version against the versions available in the rpy2 repository. Any version with a higher number than Python's pip utility supports cannot be installed.
Download the appropriate rpy2 Python wheel file (with the extension ".whl"). Install it with the Python pip utility, specifying the path to the file, for example,
>>> pip install rpy2 rpy2-2.7.6-cp34-none-win32.whl
R should now be available to IDL through the Python bridge.
Hello World
Refer to the rpy2 documentation for simple examples of calling R from Python.
From IDL, we simply pass through the Python bridge, oftentimes in a seamless way.
First, load the rpy2 "rpy2.robjects" package into Python. This runs the embedded R process.
IDL> !null = Python.run('import rpy2.robjects as robjects')
The R interpreter is the member "r" of robjects. You can get the reference into IDL directly.
IDL> !null = Python.run('import rpy2.robjects as robjects')
IDL> robjects = Python.robjects
IDL> R = robjects.r
In the simplest case, R strings can be constructed then passed directly to R for interpretation.
IDL> !null = R('ctl <- c(4.17,5.58,5.18,6.11,4.50,4.61,5.17,4.53,5.33,5.14)')
This is the equivalent of an EXECUTE function call in IDL. Generally, however, you will want to pass numeric data as numbers.
IDL and NumPy
IDL converts numeric literals to NumPy types before passing them to Python. There is a slight conflict when those variables are then passed through to the rpy2 bridge. By default, it does not automatically perform the reverse conversion from NumPy types to numeric atomic types.
This is easily overcome via a simple work-around.
Prior to passing any numeric data from IDL to Python, execute the following two lines
IDL> !null = Python.run("import rpy2.robjects.numpy2ri")
IDL> !null = Python.run("rpy2.robjects.numpy2ri.activate()")
Creating an R Function Callable from IDL
Sometimes the syntax of IDL doesn't map directly to data objects in Python or R. Much like the Python.run() command, it's possible in those instances to pass a complete string to R for execution via the rpy2 bridge.
First, get the reference to the R interpreter itself, if you have not already done so.
IDL> !null = Python.run('import rpy2.robjects as robjects')
IDL> R = Python.robjects.r
Define a function in R that will simply square a number. We need to pass the function definition as a string literal to R, where it will be interpreted.
IDL> sqr = R('function(x) x^2')
The R function "sqr" is now directly accessible to IDL as a function
IDL> b=sqr(2)
IDL> help, b
B PYTHON <ID=278393> <class 'rpy2.robjects.vectors.FloatVector'>
To copy output R data stored in Vector-types, such as the FloatVector shown above, use the Python.tuple method.
IDL> value=(Python.tuple(b))[0]
IDL> print, value
4.0000000
IDL> help, value
VALUE DOUBLE = 4.0000000
Python-R Example
See the example code at the bottom of the rpy2 introduction web page here. It generates a graphic similar to this:
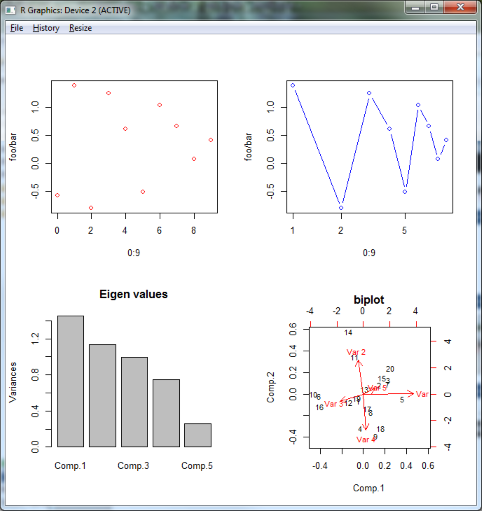
Random numbers are involved in seeding the example data set, so your output may not be identical.
IDL-Python-R Equivalent Example
The following block of code executes the equivalent commands from IDL, but in this case the input data is generated within IDL and passed to Python then on to R.
There are many comments which will help guide you. Copy and paste the code to your IDL command line.
; This code is a conversion from the pure Python "One more example" at the bottom
; of the page http://rpy.sourceforge.net/rpy2/doc-dev/html/introduction.html
!null = Python.run("from rpy2.robjects.packages import importr")
; The following two lines allow us to pass numeric types through
; to R methods, for example, "stats.norm(10)".  IDL, by default, converts all
; numeric variables to numpy types rather than treating them as the
; underlying number.  R requires the underlying number instead, by default.
; Unlike IDL, it does not assume that numpy has been imported.  The
; "activate()" method allows us to continue to pass numpy types
; to R where R then converts them back to the required type.
!null = Python.run("import rpy2.robjects.numpy2ri")
!null = Python.run("rpy2.robjects.numpy2ri.activate()")
importr = Python.importr
graphics = importr('graphics')
grdevices = importr('grDevices')

base = importr('base')
stats = importr('stats')
;
; Generate some data on the IDL side to be evaluated on the R side,
; via the Python bridge.
;
array = Python.Import('array')
XX = Indgen(10)
x = array.array('i', XX)
y = randomn(seed, 10)
; Create a 2x2 grid of Python plots and show the first plot
!null = grdevices.windows()
!null = graphics.par(mfrow = array.array('i', [2,2]))
!null = graphics.plot(x, y, ylab = "foo/bar", col = "red")
; Create an equivalent IDL plot of the data
p = plot(xx, y, $
  color='red', ytitle = 'foo/bar', xtickdir= 1, ytickdir = 1, xminor = 0, yminor = 0, $
  symbol = 'D', linestyle = 'none', layout = [2, 2, 1], $
  dimensions = [768, 768], xstyle = 2, ystyle = 2)

Python.kwargs = hash('ylab', 'foo/bar', 'type', 'b', 'col', 'blue', 'log', 'x')
;
; Due to the syntax required by Python and a mistmatch with IDL syntax,
; we can't execute the next plot using dot notation.  But we can construct
; the Python syntax as a string and use the Python.run() method instead.
;
; Transfer references to the x and y IDL variables and the graphics package
; from IDL to Python before calling the plot method.
;
Python.x = x
Python.y = y
Python.graphics = graphics
!null = Python.run("graphics.plot(x, y, **kwargs)")
;
p = plot(xx, y, $
  color='blue', ytitle = 'foo/bar', xtickdir= 1, ytickdir = 1, yminor = 0, $
  symbol = 'D', position = 2,  xlog = !true, $
  layout = [2, 2, 2], /current, xminor = 0, xtickvalues = [1, 2, 5], $
  xstyle = 2, ystyle = 2)
;
; Execute principal components analysis on IDL-defined data and plot results.
;
;m = base.matrix(stats.rnorm(100), ncol=5) ; this is the R equivalent
m = randomn(seed, 5, 20)
pca = stats.princomp(m)
!null = graphics.plot(pca, main="Eigen values")
!null = stats.biplot(pca, main="biplot")
;
; From the result, extract the tuples associated with the principal components
; calculation.
;
pcatup = Python.tuple(pca)
r = Python.tuple(pcatup)
;
; Show the data in the R principle components results, as represented by
; Python objects.
;
Help, r
Print, r
fv = Python.tuple(r[0])
print, fv
;
; Run IDL's principal components to extract eigenvalues
;
i = pcomp(m, eigenvalues = e)
p = barplot(layout = [2, 2, 3], /current, $
  lindgen(e.length) + 1, reform(e), $
  ytitle = 'Variances', $
  title = 'Eigen values', xminor=0, $
  xtickname = 'Comp. ' + ([1, 3, 5]).tostring(), $
  xstyle = 1, $
  xtickval = [1, 3, 5], $
  fill_color = 'light gray', $
  thick = 1, $
  ytickdir = 1, $
  xticklen = 0, $
  yminor= 0)
p.axes[2].hide = 1
p.axes[3].hide = 1
My goal was to use "native" IDL syntax as much as possible when calling R, without resorting to passing string literal commands for either Python or R. In other words, the R calls "look like" IDL calls.
I also wanted to show the equivalent commands for generating similar plot output in IDL, relative to the R output so you will see a pair of plot windows displayed, the R figures shown above and the IDL equivalents, as shown below.
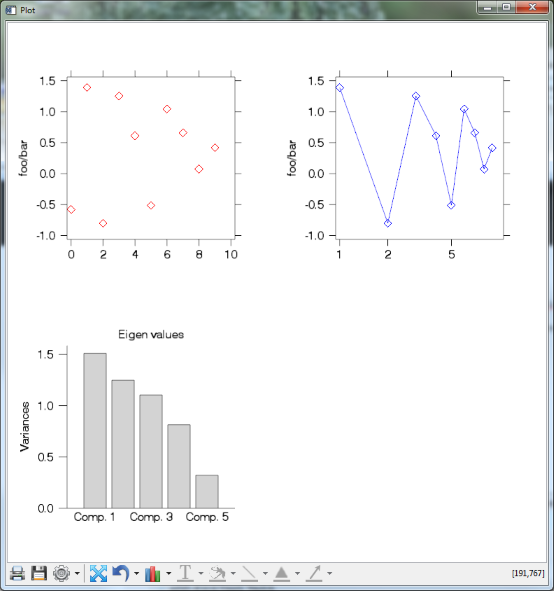
The IDL code for recreating the R biplot figure in the lower right is left an exercise for the reader!
Coming Soon
A soon-to-be-published blog post on the IDL Data Point will include a more in-depth example, incorporating an R-based data classification scheme into IDL.