Crop Counting on Mars!?
Believe it or not, there is a new market for precision agriculture on our big red neighbor. However, this is not your conventional agriculture analysis, but rather an innovative use of the crop counter tool in ENVI® Crop Science.
Our crop of choice that we will be counting is not alive, but rather lifeless scars on the surface of Mars. Because Mars has such a thin atmosphere, about about 0.6% of Earth's mean sea level atmospheric pressure, smaller meteorites don't necessarily burn up in the atmosphere like they do in our night sky. Instead, the surface or Mars is covered in small, round craters which present ideal objects to find with the crop counter tool. These craters range in size from a few meters in diameters to kilometers in size. For this case, I'm focusing on caters that are about 40-50 meters in diameter.
Step One: Getting the Data
The coolest thing about all of the international space missions is that most of the data collected is easy to find and freely available. For Mars, I actually decided to use a DEM (Digital Elevation Model) that was derived from stereo pairs with the HiRISE (High Resolution Imaging Science Experiment) sensor which is on board the Mars Reconnaissance Orbiter. The HiRISE sensor takes images with up to .3 meter spatial resolution, which allows for lots of detail in the images that are captured. The resulting DEM I used had .99 meters per pixel for spatial resolution. The exact DEM I decided to go with can be found here.
Here is a screenshot of a portion of the image that I used to count craters:
I chose this image because it had lots of uniform, round craters. After exploring the craters a bit, I decided to look for craters between 35 and 45 meters in size. Before I could count the craters, I first needed to figure out how I wanted to count them.
Step Two: Preprocessing to get the Data Analysis Ready
For the crop counter, the best way to get accurate results is to preprocess your data and do some thresholding. The first reason for this is that thresholding helps prevent false positives from being counted. Secondly, thresholding drastically increases the speed for finding crop centers. This speed increase is because, when pixels are Nan's, the crop counter skips those pixels and decreases processing time. For crater counting, this preprocessing step just becomes a matter of how to get the craters to pop out of the image.
After some thinking, I decided to isolate the crater pits themselves I would use some smoothing, band math, and then thresholding. Here are the exact steps I took to count craters:
1) Smooth the data with a kernel that is the twice the size as the largest crater size we are looking for.
The kernel size for smoothing the data was 91 because we were looking for craters between 35 and 45 meters in diameter. Below you can see the smoothed DEM with a similar color table as above:

2) Take the difference between the smoothed data set and the actual DEM.
With the smoothed DEM, the crater features we are looking for should be pretty much erased. This means that taking the difference between our smoothed image and our original image will return the approximate crater depth. Because the crop counting tool works with bright images we can then use the crater depth image with the plant counter after one more step is applied. Below you will see the the difference between the DEM and the smoothed image. The green areas have a higher value (height in meters) and the red areas have a lower value.
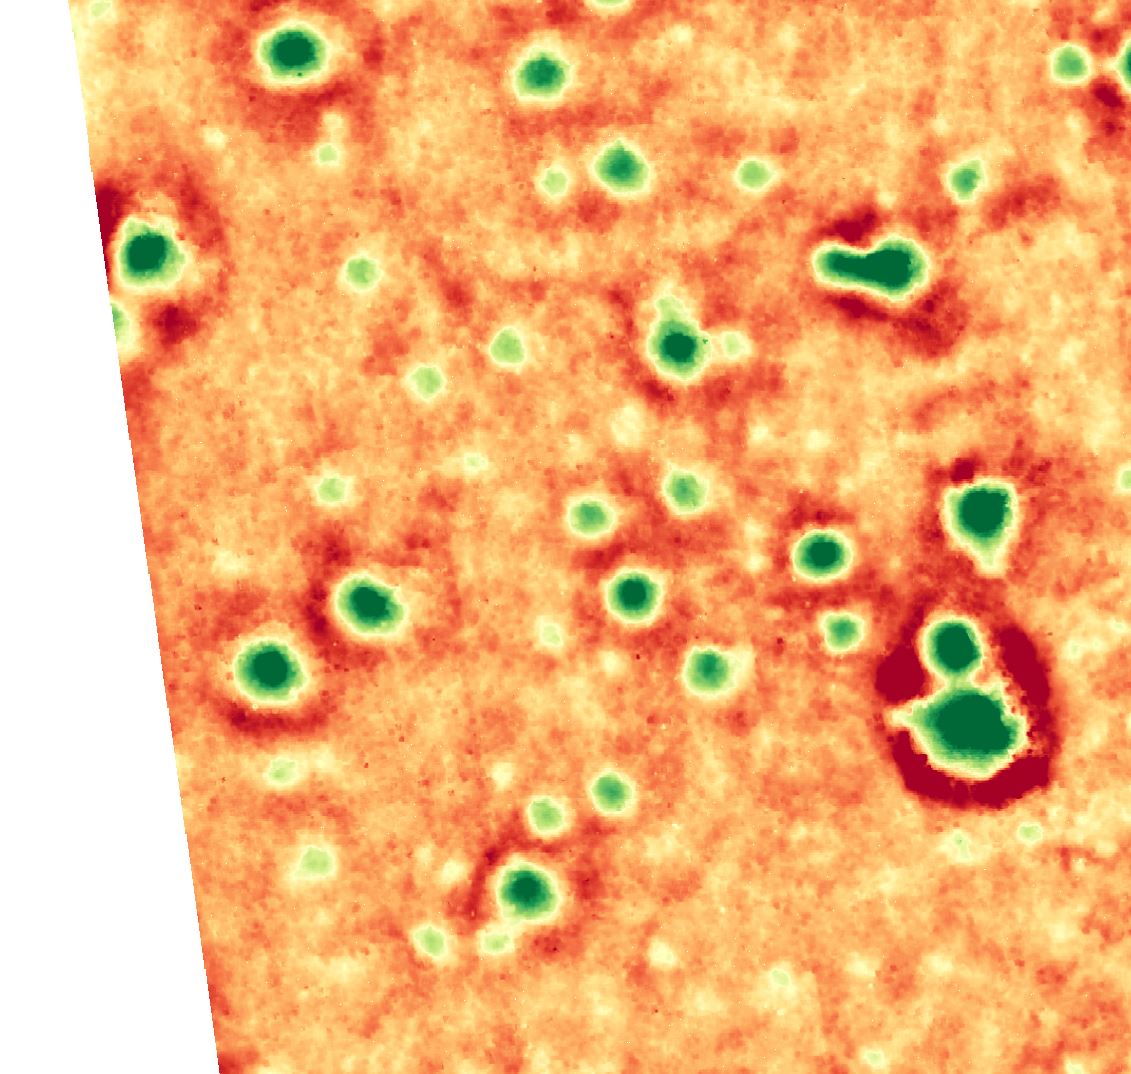
3) Threshold our crater depth image
This step is very important to reduce false positives for counting craters because our difference image is quite noisy in some places. This step eliminates smaller craters and noise in our image by saying the crater depth needs to be greater than 'x' meters. I used .75 meters for this step which really isolates the craters I was looking for. To illustrate how this helps isolate the craters we are looking for, you can see the image below. This screenshot is of the original DEM with the image difference shown after a threshold has been applied. At this point you can see that we have isolated most of the craters with a few spots of noise here and there.
Step Three: Using the Crop Counter!
Now that we have preprocessed our data and have a great image to count craters in, it's time to use the crop counter. Here are the setting I used in the crop counter to find the crater locations:
CropCountTask = ENVITask('AgCropCount')
CropCountTask.INPUT_RASTER = ThresholdRaster
CropCountTask.WIDTH_IN_METERS = 0
CropCountTask.PERCENT_OVERLAP = .01
CropCountTask.SMOOTH_DATA = 1
CropCountTask.SEARCH_WIDTH = [35,45,1]
CropCountTask.MAX_TILE_SIZE = [400,400]
After running the task, here is what our results look like. This image is a grayscale version of the DEM with the crop locations shown as cyan circles.
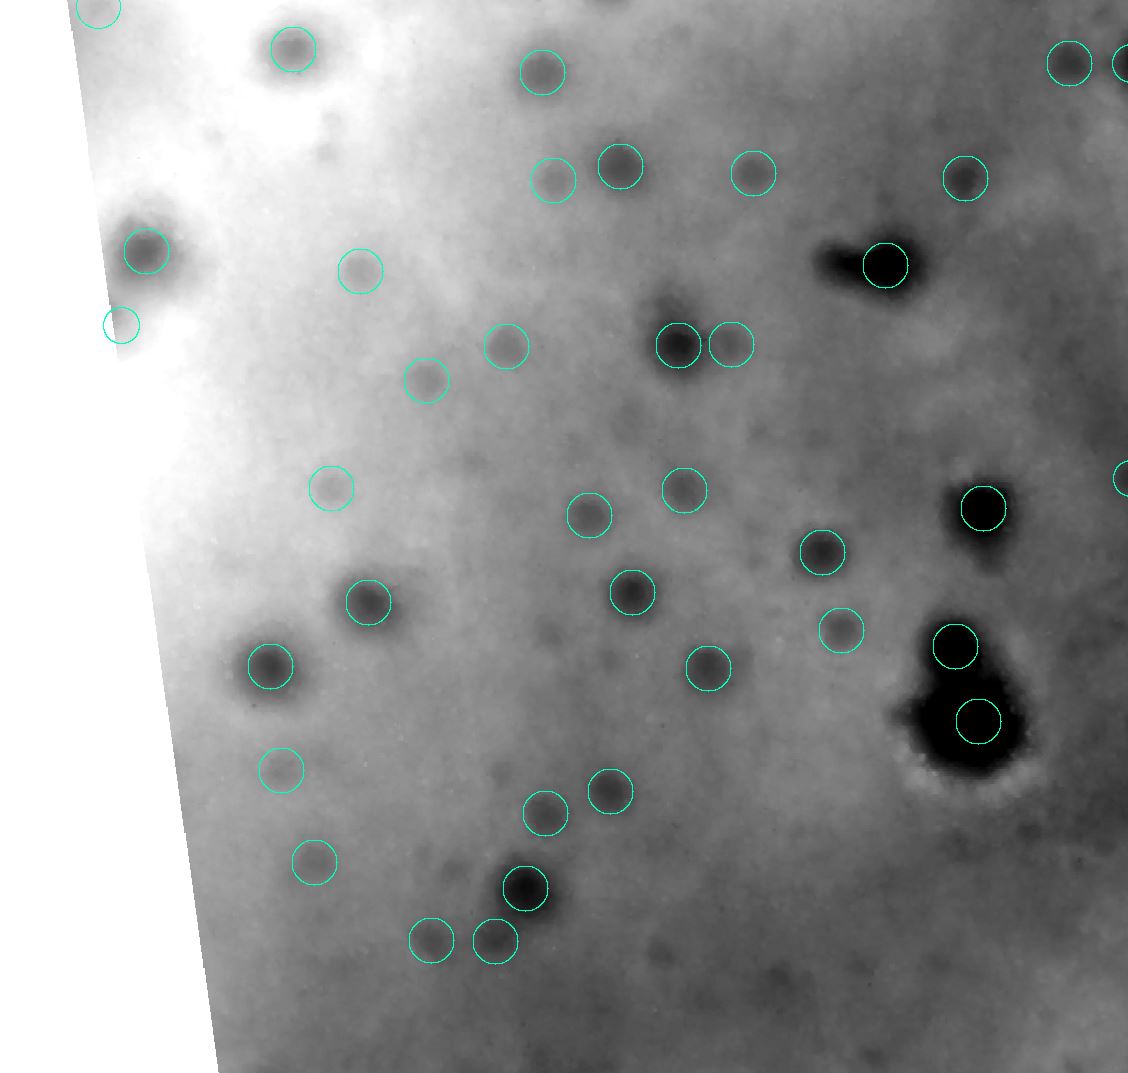
As you can see, the crop counting tool does a pretty good job of finding the actual crater locations!