Deriving a Geospatial Signature
Anonym
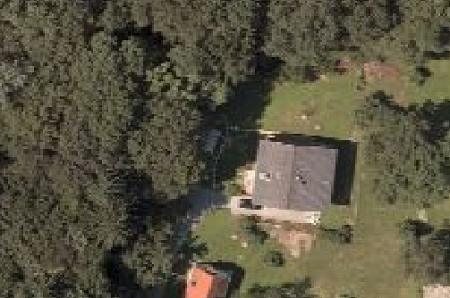
Just as the features of our handwriting style can uniquely identify us as individuals, objects can be uniquely identified using a set of their distinctive features. In this image, it is easy to visually separate the house and trees, but what features do you think would help a computer algorithm automatically distinguish these two objects?
We might try for example
- The color of the object
- The amount of radiation reflected at 900 nm (Near Infrared)
- Texture characterizing the roughness
- Length of straight edges or height
- A temporal feature such as reflectance that changes over the seasons
- A contextual feature such as the distance of an object from a road or environment such as urban or rural.
Whichever features we choose, we can assemble them into a vector that summarizes the characteristics of an object. The goal is to derive a set of features that can unambiguously distinguish different objects; once we have this optimum set of features, we can define unique object signatures.
We often think about a raster as an image, but a raster is also a geospatially grouped set of feature vectors at a particular moment in time. Each pixel or group of pixels can be considered an unknown object, while features/characteristics are represented as bands. With a good set of measured features, we can identify objects by signature and learn how the objects interact, or how a state changes over 3-D space and time.
As an example, the following raster consists of features derived using ENVI from source imagery acquired by Airbus Defence and Space’s Pleiades-1A satellite. The source image is a collect of four spectral bands: Blue (495nm), Green (559nm), Red (656nm) and NIR (843nm) acquired at 2014-10-04 16:14 UTC (about local noon) over Florida (center location 25°42'44"N, 80°25'44"W).
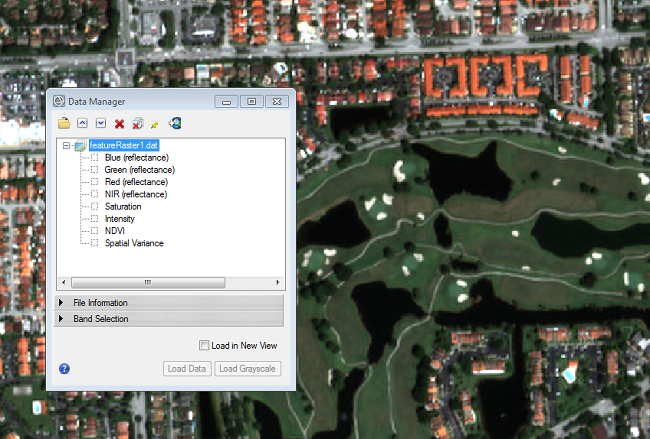
The raster shows eight derived features forming a feature vector. In ENVI we can easily derive these features and stack them into a raster. Although this can be done using the user interface, in this post I will focus on how to write the code. Any of these commands can be scripted for desktop use, batch execution, or deployed to an enterprise or cloud environment for large scale analysis using ENVI Services Engine.
First it is important to derive a calibrated raster that represents top of atmosphere reflectance at specific wavelengths. This step in data normalization is critical if our intent is to compare data over different acquisition times, or from different sensors.
- rasterRef = ENVICalibrateRaster(raster, CALIBRATION='Top-of-Atmosphere Reflectance')
Objects can often be distinguished by their visual color characteristics. To better represent this we can create a color transform from Red, Green, and Blue to Hue, Saturation, and Intensity.
- rasterHSI = ENVIRGBToHSIRaster(raster)
Indices have been found that are sensitive to different objects for example vegetation. While ENVI has many predefined indices, for this example I use Normalized Difference Vegetation Index (NDVI) in the feature vector.
- rasterNDVI = ENVISpectralIndexRaster(raster, 'NDVI')
Once we have our features, we can stack these together into a multiband raster, or equivalently a 2-D set of feature vectors.
- rasterStack = ENVILayerstackRaster(ArrayOfrasters, GRID_DEFINITION=gridDefinition)
Many more features could be defined, but for this example I have limited it to these eight that represent reflectance, color, an index that is sensitive to vegetation, and texture. In addition, these features have been scaled to zero mean and unit variance by using the ENVIPixelwiseBandmathRaster, in order to optimize display and processing. The raster represents a collection of measurements on this feature vector. The question is: can these feature vectors yield unique signatures?
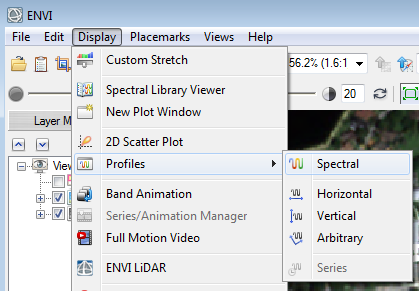
We can explore the values of the feature vectors in this image using the spectral profile viewer. Clicking anywhere on your image will show the feature vector associated with that pixel location. Shift + Click will let you add multiple locations to your plot, and the options menu and curve properties will let you add a legend.
From the spectral profile viewer, we see that a road, park, and lake produce three unique feature vectors. The indices from one to eight represent each of the eight defined features, and the data value represents the normalized value of that feature.
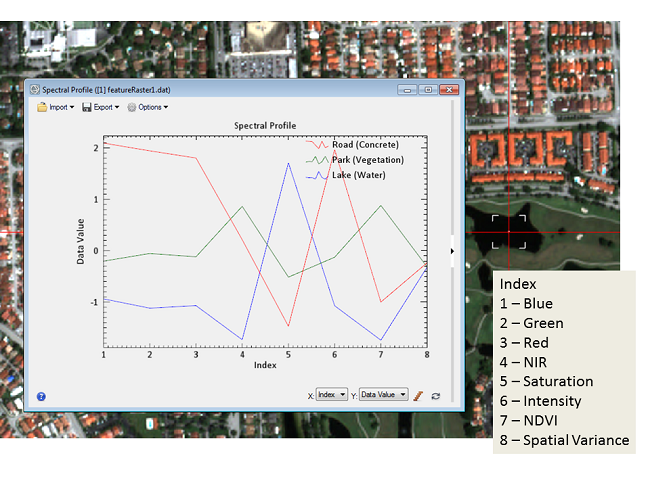
If we continue to explore the image we may find that the feature vectors look similar within the same object class (road, park, lake) but unique across the object classes. If so, that means we have found signatures that can be used to uniquely identify these objects.
Using ENVI to quickly create and analyze features in this way helps us to explore the answer to these two questions:
- What features can I derive from my data that will characterize the object, and as part of a feature vector, uniquely separate it from other object classes? In the above example Intensity, NIR, and Saturation appear to be good discriminators, while the texture (index 8) does not discriminate well, at least for these three object classes.
- As we design the next remote sensing system, what features should it measure? This may include features based on wavelength, polarization, motion, or others.
In this blog I touched on the value of defining and exploring features in our data. In a future article I will continue to explore how we may analyze these feature vectors using ENVI’s processing tools and develop the chain that takes us from data to insight.
What features do you believe or know are important to distinguish remotely sensed objects or environmental states? What would you like to see in ENVI to easily allow you define and explore those features?