File Storage: Using the Regions of Interest (ROI) Tool
.xml Files and Land Classification
Anonym
We are taking a short break from the Spectral Hourglass Workflow Series to discuss file storage. This blog will focus on the file sizes associated with the Regions of Interest and Scatter Plot Tools, and more specifically when these tools are used to create training data for the purposes of land use classification. All classification was done using a Landsat 8 scene collected by the USGS. For more information on Land Classification as it pertains to ENVI consider checking out some of the free trainings we offer as well as videos, whitepapers and case studies found on our website.
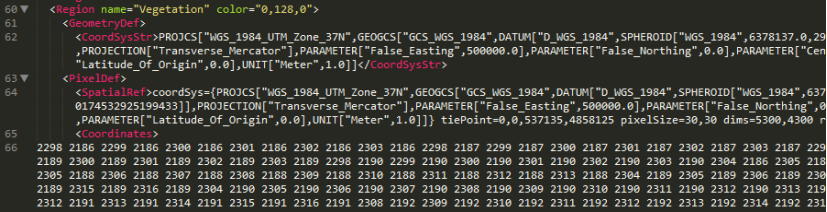
Just because a large number of pixels are contained within an ROI does not mean that the file size will be similarly large. The ROI Tool has the ability to contain an immense amount of pixels within each class and have this stored in the .xml file in a few lines of code. If you use ENVI (or many other applications) you should have some .xml files on your machine, you can view them with a code-editing software. A powerful capability within the ROI tool is the ability to apply a threshold on a band for the purposes of classifying a feature type or endmember, and this takes up a mere 10 lines of code.
Due to the nimble nature of Band Thresholding and the .xml file type you can create a large number of ‘Regions’ that help to classify potentially millions of pixels in a scene, with a file no larger than a few dozen kilobytes.
Drawing large polygons in the ROI Tool will not increase the file size significantly due to the fact that the only statements required in the code are the coordinate system of the data and the coordinates of the vertices of the polygon.
The Pixel Tab should be used for small groupings of pixels or individual pixels. When utilizing the functionality contained within the Pixel Tab incorrectly your file size increases drastically as all of the pixels are referenced in a Samples, Lines (X,Y) structure, which can be cumbersome. It is intended to be applied to a small number of pixels when you have accurately identified the desired feature/endmember and wish to create an ROI.
Overall the file sizes are not a major concern. However, there are some things to be wary of much like the use of the Pixel Tab. When you utilize the Scatter Plot to import a large number of pixels into an ROI Class, one million pixels or greater, it will result in large file sizes. This is due to the fact the spatial information for the ROI is organized in the same way as the Pixel Tab functionality, Samples then Lines. It is easy to see how when more than one million pixels are referenced individually by their exact location via Samples and Lines, the space needed to store that amount of information would be vast in comparison to Band Threshold or drawing polygons.
The Scatter Plot is incredibly useful for all types of imagery, but specifically with Hyperspectral datasets where the spatial extent is relatively small in comparison to multispectral datasets such as this Landsat 8 scene.
The best way to use the Scatter Plot when working with large swaths of data is to zoom in to a closer spatial extent and deselect the Full Band option within the Scatter Plot dialogue. This will still allow you to compare the spectral statistics of your data, but will save space in data storage. When you attempt to export more than one million pixels at a time from the Scatter Plot Tool into an ROI you will encounter a warning message, if data storage is of a concern it would pay dividends to be wary of exporting this large number of pixels.