Mapping up-to-date Wildfire Damage with ENVI Analytics
Anonym
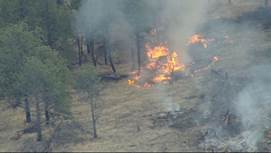
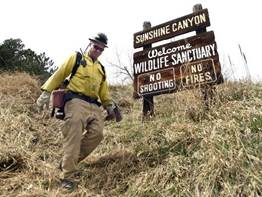
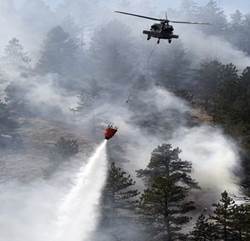
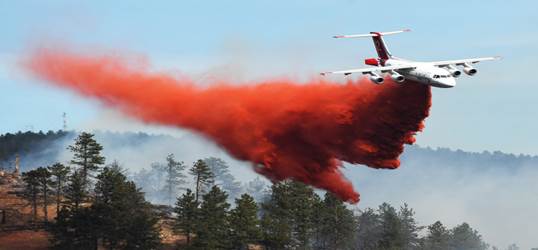
On the morning of Sunday March the 19th, a fire was ignited in the heart of Sunshine Canyon Trail in Boulder, Colorado, causing the evacuating of nearly 426 people and placing another 1,000 on high alert. The fire burned from 1 a.m. early Sunday morning until late Monday night when it was contained and then later died out. Nearly 70 acres of land and forest trails were burned and left black. It was concluded that the fire was caused by transient campers near the Sunshine Canyon Trailhead.
|
|
|
|
Being a Boulder resident and actually living in the pre-evacuation zone, I did not take this matter lightly. While I was sweating it out, my mind occupied itself with how we could map out this small disaster for government or commercial use. With NV5 Geospatial having a close partnership with Planet, we were able to quickly draw down some RapidEye 5 band satellite imagery of both before and after the fire for immediate fire extent analysis. Below I will walk through steps of how we were able to use our ENVI® analytics with the help of Planets RapidEye imagery to understand the extent of this wildfire only a short time after the disaster occurred.
|
|
|
|
The first step in our workflow was to get some imagery for before and after of the area that was effected by the fire. Below we have our (Left) pre- and (Right) post- (Right) fire images that have not been processed. As you can see in the two areas highlighted, we have some pre-processing to do. Our area of interest (AOI) for the fire is circled below in blue.
The second step in our workflow is going to be the pre-processing to get rid of some problem areas that may require atmospheric correction. For these datasets, we ran the ENVI Radiometric Correction Quick Atmospheric Correction (QUAC) on a subset of the image so we could focus our analysis only on our AOI. For more specific instruction of how QUAC works, you can visit our help documentation online for a full overview of the tool.
(PrefFire image is on left. Post-fire image is on right).
Next, after we corrected atmospheric distortions in the subset of our data, we ran the data through the ENVI Image Change Workflow. What this does is compares two images of the same geographic extent, taken at different times, and identifies the difference between them based on either a specified input band or on a feature index. With this ENVI workflow, the results are given as either a “gain” or a “loss”. In this instance, we decided to run our workflow on the ENVI Normalized Difference Vegetation Index (NDVI) so that we could extract areas of “loss” due to the fire burning healthy vegetation.
After thresholding our workflow to only include areas of “loss”, and doing some post-processing cleanup, we were able to extract the area of change or “loss” as a shapefile to overlay on top of our original imagery. This gives us a look at the extent of the damage by comparing the before and after imagery. Below we have our subsetted post-fire image with the fire extent shapefile (Left), and subsetted our original pre-fire Image with the fire extent shapefile (Right).