Take Your Analytics to the Data
Anonym
ENVI Services Engine: Change Detection
I was recently on NASA’s Earth Observatory where I was reading about the shrinking glacier in Montana’s Glacier National Park. They acquired 8 images dating from 1984 going through 2015 that focused near Lake McDonald where the Jackson and Blackfoot Glaciers were very visible in false color images. They put together a slideshow showing the time series of the extent of the glacier loss due to global warming and the changing climate. The one thing that stuck out in my mind was how time consuming it must have been to search for the data to find images that didn’t have clouds, than download the data… and after that you would still need to run your analysis or comparison.
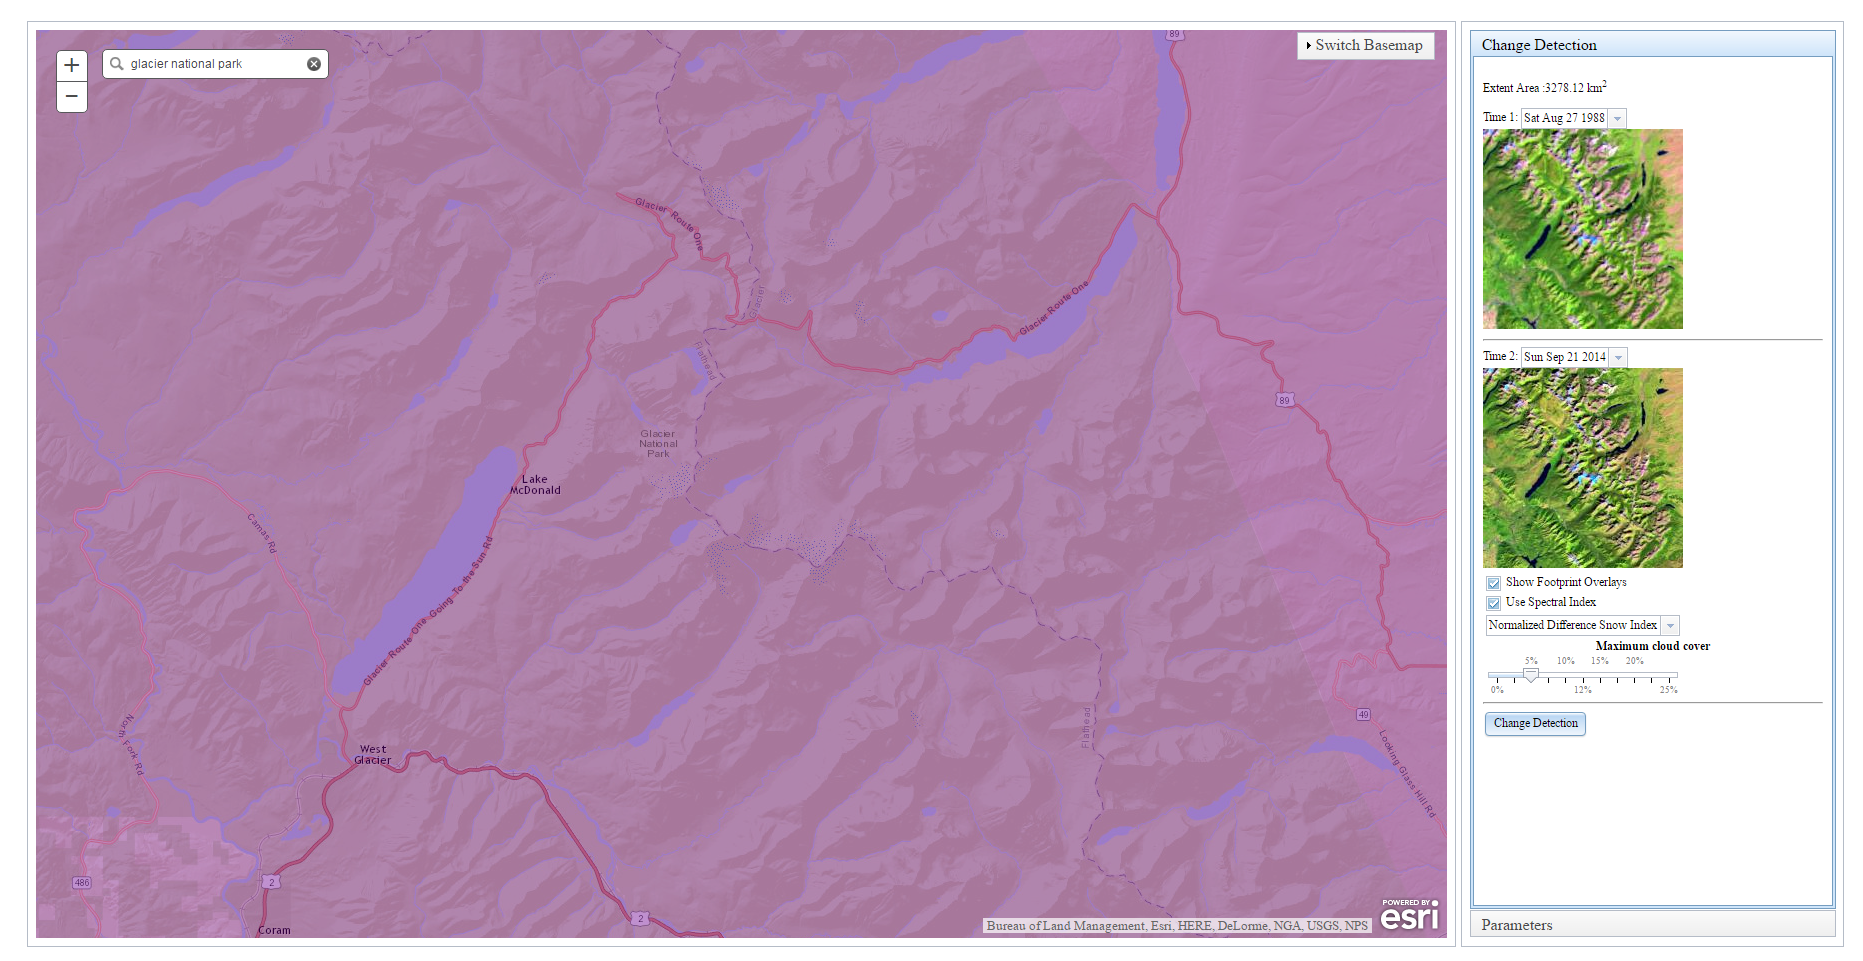
In the past few years we have started to see a shift to where users want to run the analysis where this data resides, for instance on applications like Amazon Web Services. As we continue to implement more and more ENVI tasks on Amazon Web Services, you can truly take your analysis to the where the data is. In the Change Detection example below, one of our engineers put together a quick interface utilizing ESRI basemaps to define the area of interest. By linking to ESRI’s endpoint (Landsat.arcgis.com) you can stream in the Landsat data available for that area of interest. In this example, we can search for the area we are interested in seeing (Glacier National Park), see what data is available during different years, filter out the data based upon cloud coverage, and then apply Spectral Indices if wanted:
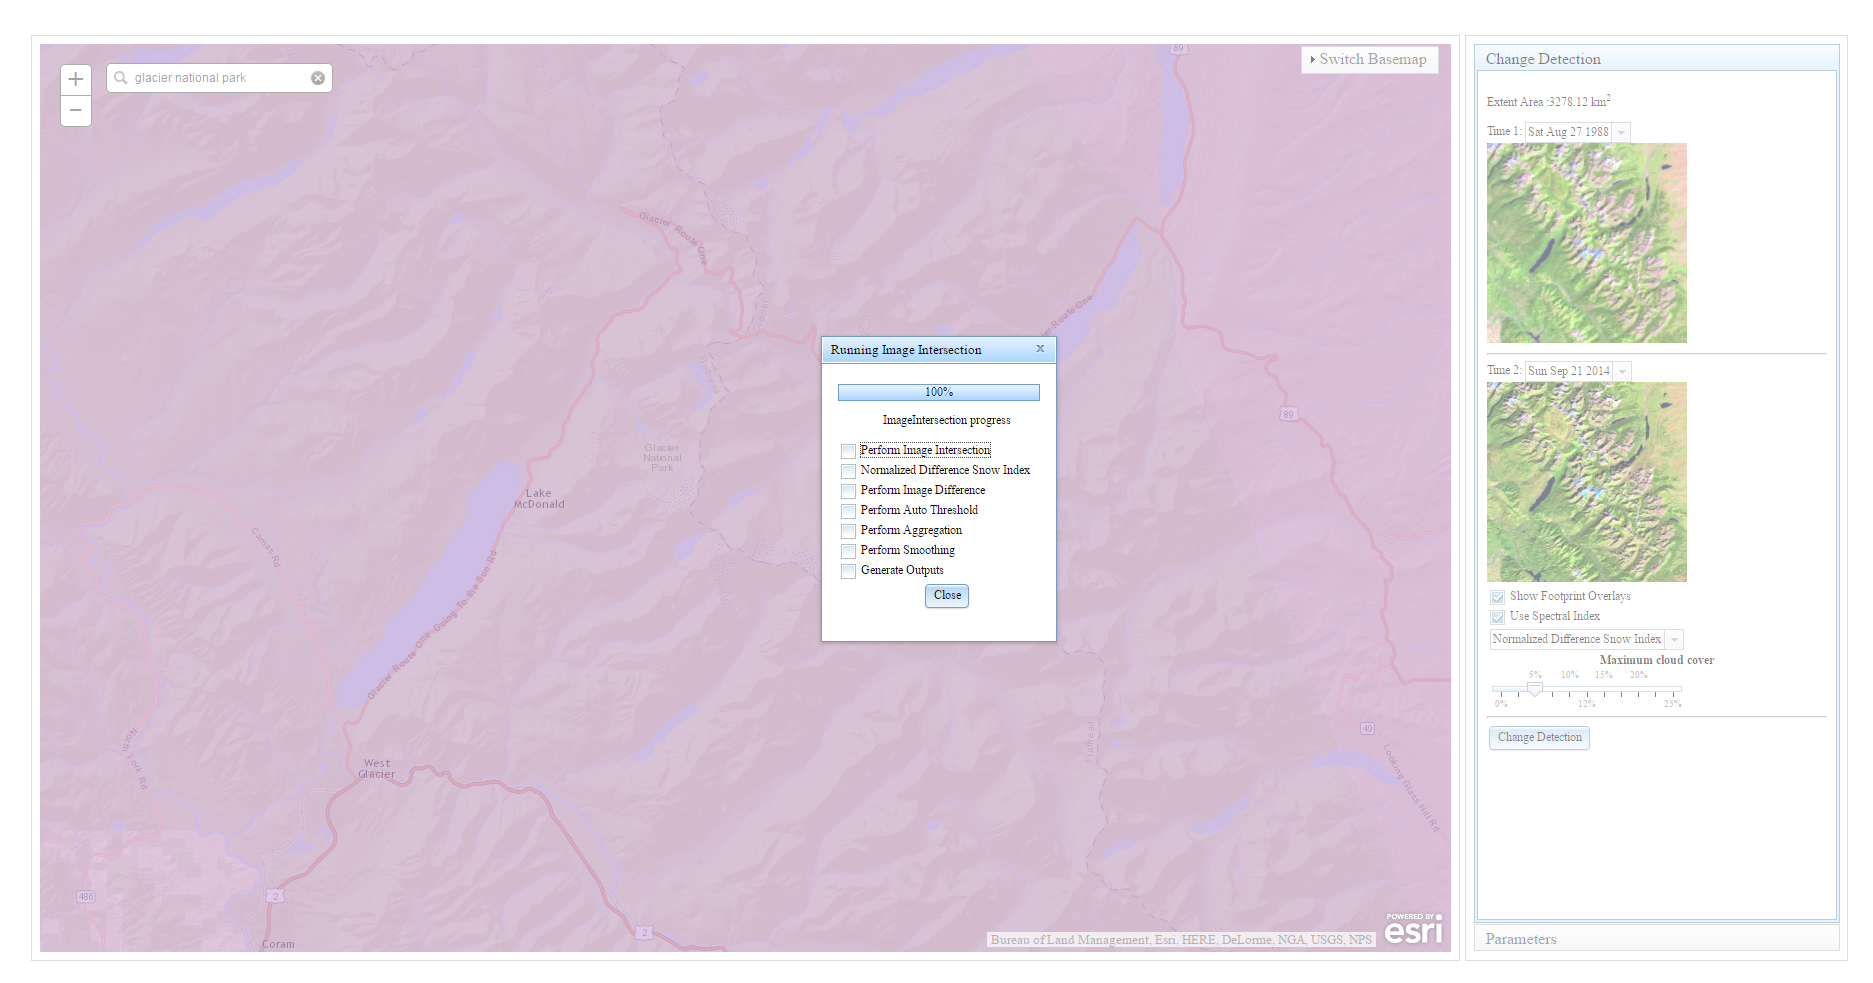
Once you have found the two scenes you want, you simply click change detection and the ENVI tasks run through the steps of the normal analysis and provide updates along the way:
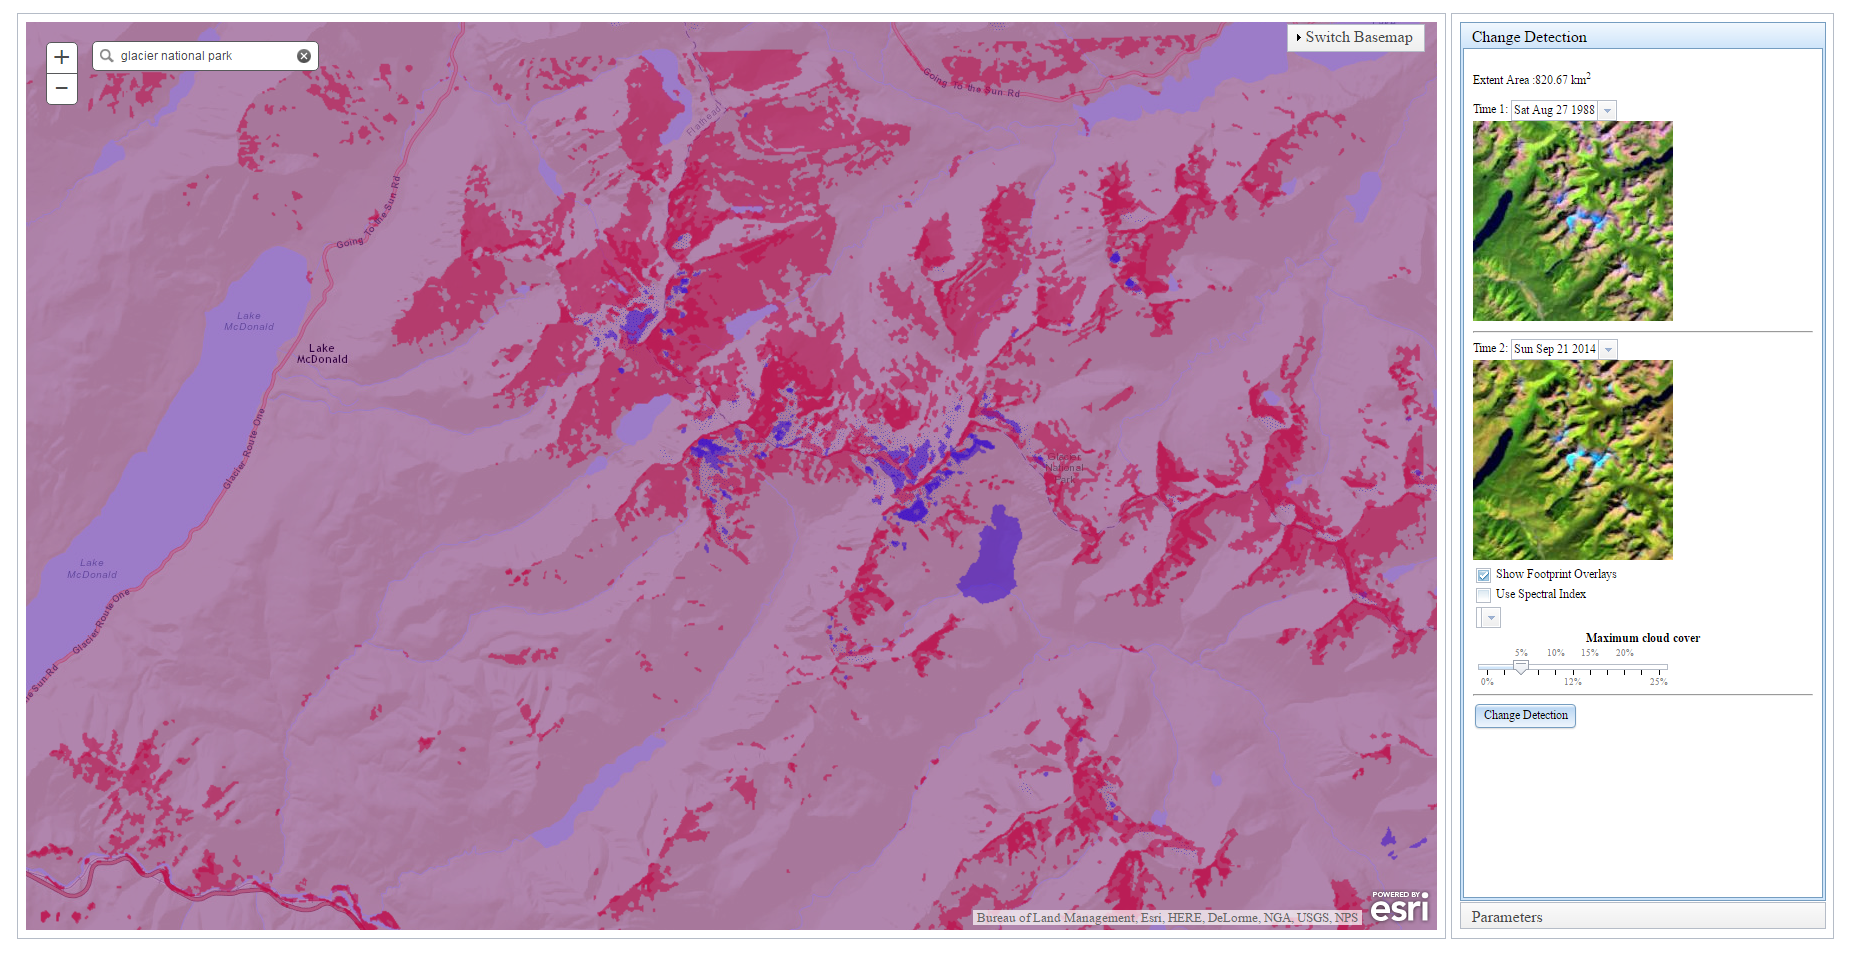
In no time at all, you are given the results of the quick change detection analysis that shows you in Dark Red (red is what has fled the image from time 1). The blue areas shown in the result are new areas to the scene. In these scenes it looks like snowpack that hasn’t quite melted. If you take a look at the examples provided on Earth Observatory, they focus on the Jackson and Blackfoot glacier, which are the areas you see in the Dark red below:
This gives you an idea of how you can further the original visual comparison and create shape files to highlight the glacier loss without having to take the time to comb through data for the right set and then download it for analysis. The possibilities for applications like this are really endless as we continue to wrap ENVI functionality into ENVI tasks. ENVI Services Engine allows you to quickly and easily take the analysis to where the data is and save time on downloading, as well as utilize powerful processing tools.