Taking a deep dive into SAR data
Anonym
I feel lucky this week to be immersed in a SARscape class where we’ve been diving into the weeds of Synthetic Aperture Radar (SAR) analysis. Alessio Cantone is here, all the way from Italy, just to teach this class, and has brought with him a level of knowledge and experience about SAR that we don’t get to see very often. So today I’d like to share with you just a couple of the things I’ve learned so far this week.
First, I have often wanted to take a deep-dive into “What is coherence as it relates to SAR data?” and yesterday we spent several hours on just that very topic. It turns out that coherence is a measure of stability over time both in the amplitude and phase components of the signal. In other words, a coherence image will show us what has changed, and one of the greatest things about the “how” behind it is that we can see change in coherence images that we could never distinguish with our eyes from an optical image.
Courtesy of Sarmap
Here’s how it works. First let’s think about phase. Say you have a pulse with 3cm wavelengths and you are imaging a forest. The size of the wavelength is very similar to the size of the leaves thus the signal will interact with the canopy. Due to wind and motion of the canopy, it is unlikely that images from time 1 to time 2 will be similar, and therefore coherence I slow. Conversely, think about a manmade structure that does not move. Likely the signal will be highly similar from time 1 to time 2 thus coherence will be high.
Overall, so far we have considered the phase component of the signal. The amplitude portion of the signal is a measure of how much signal is returned. This will be very high for manmade objects, and very low for water, where vegetation will give an average and inconsistent return due to signal bouncing around in the canopy.
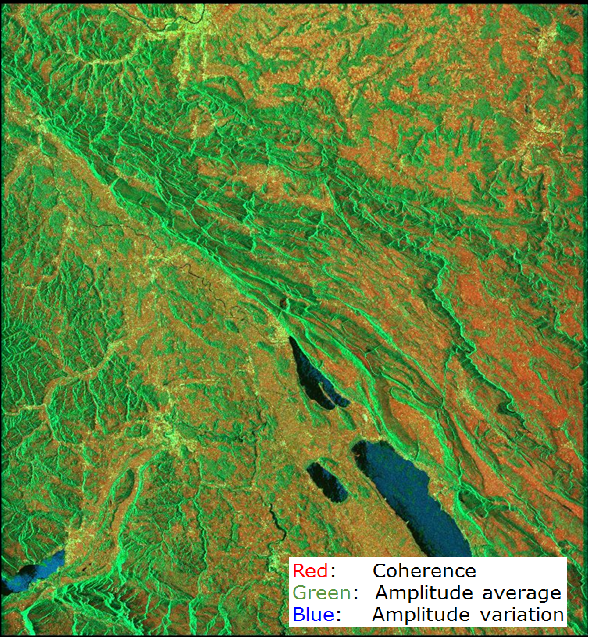
A popular way to visualize the phase and amplitude components together in order to extract a meaningful visualization is to load both the coherence and amplitude components into different channels of the display. For example, loading the coherence image into the red channel, the amplitude average into the green channel, and the amplitude variation into the blue channel, we come up with a false color image as the one above.
High coherence with high amplitude represent urban features thus urban areas appear yellow. Vegetation generally has low coherence and consistent average amplitude without much amplitude variation thus it appears green, and features with low coherence that also may have some amplitude variation but almost very low average amplitude represent water which appears very dark or even blue.
Overall, SAR data are highly complex but fascinating to work with and have relevant applications across industries including vegetation analysis, change detection, feature extraction, highly accurate terrain calculation, and many other use-cases. Here are just a few of those applications:
Agriculture: SAR is an excellent resource for monitoring forest regrowth, crop monitoring with the use of a multi-temporal SAR series, and in the image below, studying change over time including weed emergence and crop development and maturity.
Activities Map: Using interferometric correlation (aka.“coherence”) to extract thematic information for land cover characterization. In the case below, the black features are paths, roads, and meeting places used by vehicles, humans, or animals during the interval of time between the two input images. Extracting these features cannot be achieved with the optical data.
Displacement Mapping: Large earthquakes or small areas of subsidence can be mapped to a mm-scale accuracy using SAR data and interferometric processes.
I look forward to learning more and now I better get back to class!