Using ENVI Crop Science for Precision Agriculture Solutions
Anonym
Farmers and agricultural services need timely and accurate data in order to make decisions. These decisions include when to plant and harvest crops, how often to irrigate fields, and how much fertilizer and pesticides to apply. For the most accurate assessments, farmers need a variety of data, including soil moisture, weather, nitrogen content, leaf area index, and others. Most of these require field-based measurements taken at regular intervals.
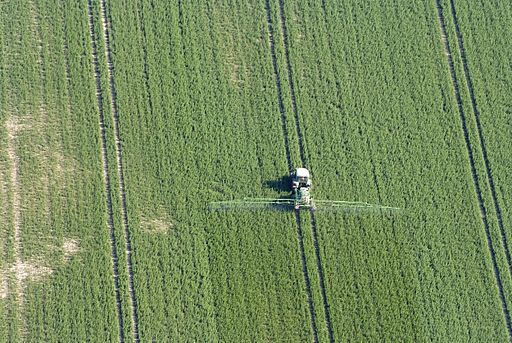
Photo: Martina Nolte, License: http://creativecommons.org/licenses/by-sa/3.0/de/legalcode
Satellite and airborne remote sensing can be used to monitor crop health and development when extensive field studies are not feasible. Remote sensing analytic tools can be used to alert farmers to potential problems in a field such as pests, drought, irrigation leaks, and possible equipment failure leading to irregular fertilizer application. They can also help improve farming efficiency by reducing the need for manual field assessments on a regular basis.
The new ENVI® Crop Science platform provides remote sensing analytics for precision agriculture and agronomy. This article provides examples of how ENVI Crop Science can help solve problems related to crop management.
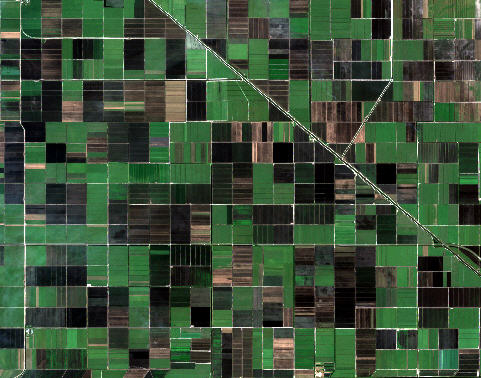
Multispectral image of sugarcane fields in Florida.
This image contains modified Copernicus Sentinel data from 2016.
Images are available from the USGS EarthExplorer website.
ENVI Crop Science was designed for use primarily by agronomists and advisory services. Agronomists are scientists who study environmental variables related to plant health, irrigation, soils, and pest control. Advisory services are trusted individuals or companies who advise farmers on best practices for crop management. They know the local conditions and are familiar with a particular farm's production history and past issues. Examples include crop scouts who examine fields and advise farmers on the health of crops, and supply companies who sell fertilizer, seeds, and pest-control chemicals. Here are a few scenarios and questions that they might encounter and how ENVI Crop Science can help.
I am starting to see the effects of fruit greening in my orchard. To estimate crop loss, I need to know the size of each tree canopy and the number of trees. This will help me estimate yield predictions and will provide input to insurance claim submissions.
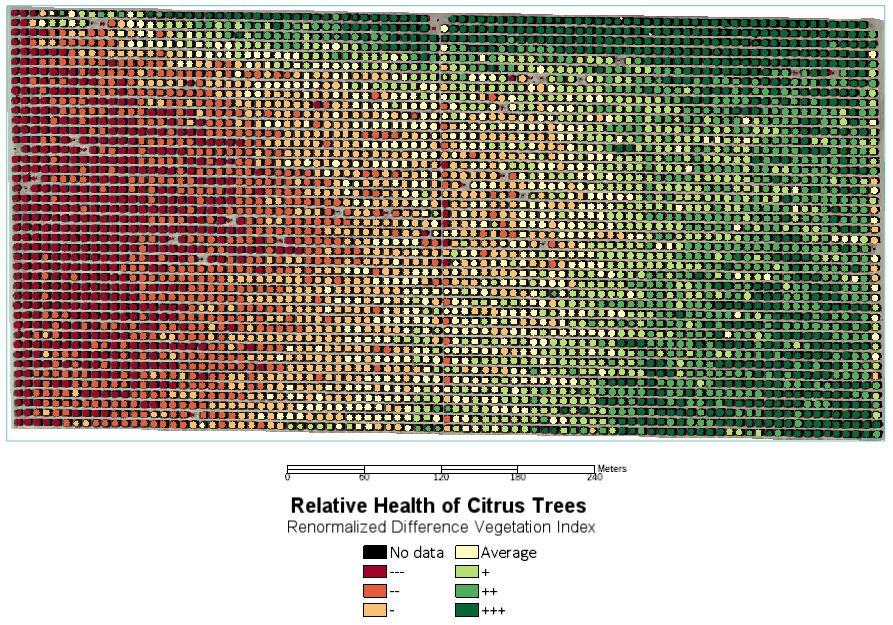
Tools are available to count individual crops and to assess their condition. If you have access to high-resolution satellite or UAV imagery, use the Crop Count tool to locate and record the sizes of individual crops. You can save this data to a shapefile or to a JSON-formatted text file. Then use the Crop Metrics or Crop Metrics with Spectral Index tool to calculate basic statistics for the crops, based on a spectral index or other derived product. The following image shows the result of using the Crop Metrics with Spectral Index tool to calculate the mean Renormalized Difference Vegetation Index (RDVI) for citrus trees. The RDVI is used to assess the relative health of the trees.
Example of using the Crop Metrics tool to assess the relative health of citrus trees. Source: High Resolution Orthoimagery (four bands), courtesy of the U.S. Geological Survey.
Which areas of my field are getting healthier over time, and which areas need attention?
The Hotspot Analysis tool can help you look for areas in a satellite or airborne image that are relatively different than the rest of the image. The difference can be in terms of crop health, soil moisture content, or other derived imagery that is available.
The example below shows hotspot images that reveal relative differences in crop health during a given week, for a circular irrigation field. Crop health can be inferred using any of ENVI's broadband vegetation indices. This example shows patterns of relative crop health based on the Modified Triangular Vegetation Index (MTVI):
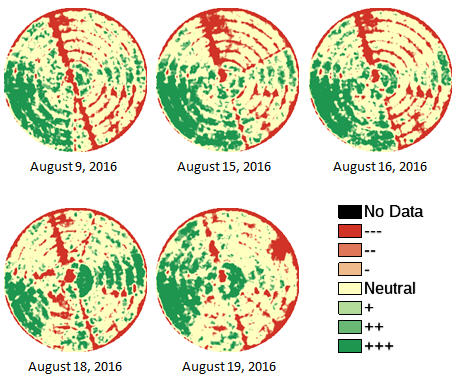
Hotspot images showing relative differences in crop health in a circular irrigation field. Source: PlanetScope 4-band analytic orthorectified scenes (3 meter pixel size), courtesy of Planet Labs, Inc.
Hotspot images do not provide actual measurements of crop health, but rather they provide a quick glance of relative differences. Red pixels indicate more statistical clustering of low spectral index values. Green pixels indicate more clustering of high spectral index values (called hot spots). Yellow pixels indicate areas with no significant clustering.
How can I create a map presentation of my results?
ENVI has several tools to help you create presentations of crop counting, crop metrics, and hotspot analysis results. You can add gridlines, classification legends, color bars, scale bars, and text annotations as needed to create maps.
You can then export the view of the map (including images and annotations) to an ENVI or TIFF image file at any specified print resolution. This is a good option for creating one-time presentations. For larger-scale production, use the Crop Science API and Geospatial Services Framework (GSF) to automate processing in the cloud.
I subscribe to new satellite images as they become available. Can I create derived products from them in a batch environment?
All of the ENVI Crop Science tools are available as API routines so that you can write an IDL script to process new imagery and to write custom tasks or workflows in a desktop environment. ENVITasks are also provided if you want to run ENVI Crop Science analytics in the GSF enterprise environment.
In conclusion, the ENVI Crop Science tools can be used alone or in combination with existing ENVI tools such as classification, spatiotemporal analysis, and spectral indices. The combined use of these tools, along with GSF, can help you save time. Instead of scanning dozens of images to look for problem areas, you can automatically generate reports that indicate specific areas with which to focus your attention.