Using LiDAR to Determine Ideal Solar Panel Placement
Anonym
Cities around the world are searching for new ways to generate power in an effort to lighten the load on traditional power sources. Solar power is a very viable option for many municipalities, and many major cities are investing resources into assessing the impact that large-scale solar projects could have on their energy consumption. As an example, New York City commissioned LiDAR flyovers of the city in 2010 and released a map in 2011 that allows residents to click on their building to find out how much power they could generate by installing panels on that building.
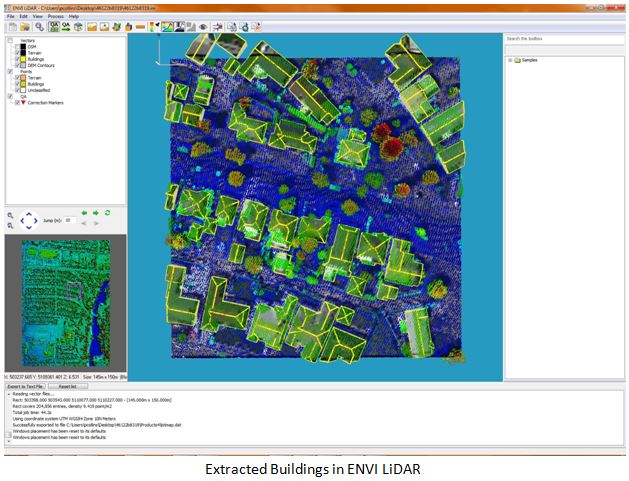
The availability of LiDAR data is increasing for many industries, and it is useful for solar projects as it contains very accurate elevation data that can be used to determine ideal places for solar panel placement, as shown below. The first step was to obtain LiDAR data, which I found on the National Oceanic and Atmospheric Administration's (NOAA) website. The particular data I found was over the city of Longview, WA. With the data in hand, I used ENVI LiDAR to automatically extract a Digital Surface Model (DSM), building footprints, and rooftop vectors.
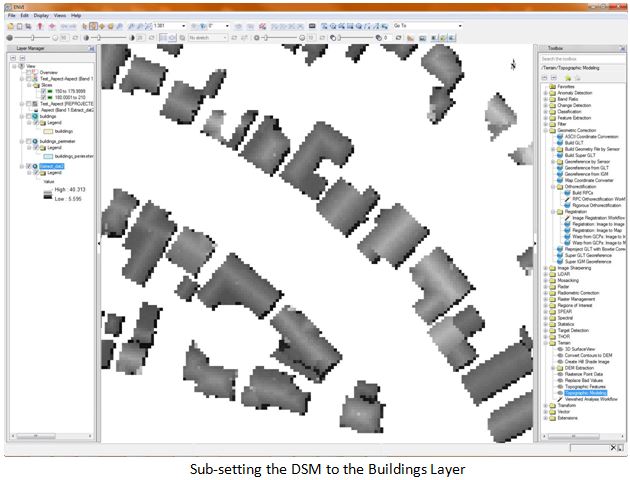
Once I had the building features and surface model extracted, I was able to push them over to ENVI for further analysis. ENVI allowed me to subset the DSM to the building layer so I could focus my analysis on the rooftops. Here you can see the sub-setted surface model.
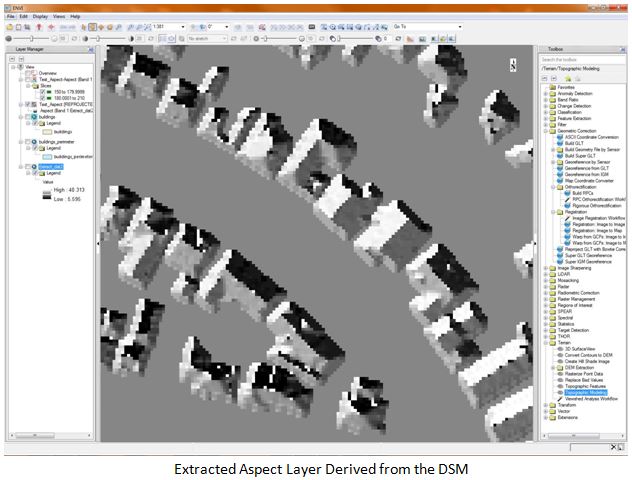
The next step was to run a terrain analysis on the DSM to calculate both the slope and aspect of the building roofs from the scenes. Below you can see the extracted aspect layer. Note how the areas outside of the buildings are flat, as those areas were masked out of the analysis, which allows for quicker analysis and easier interpretation of the results.
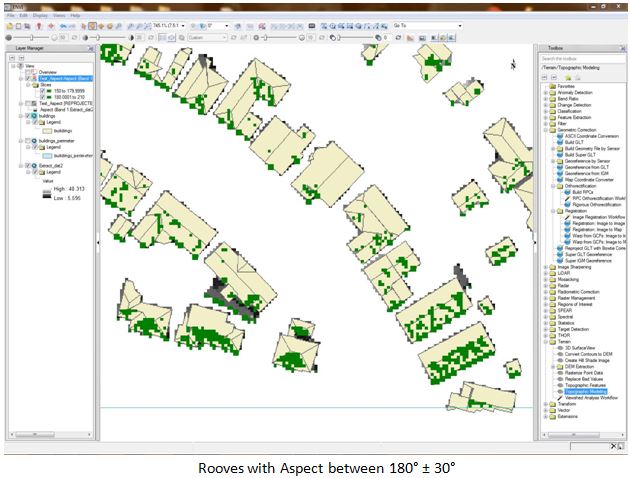
The solar industry tells us that the best aspect for solar panel placement is due South, with a range of plus or minus 30 degrees and a slope with angles between 20 and 40 degrees. Using ENVI, I was able to extract the DSM points that fell within these specifications and create new layers from them. Here you can see the buildings layer with areas of preferred aspect.
Here you can see the areas with the desired slope attributes for ideal solar panel placement. 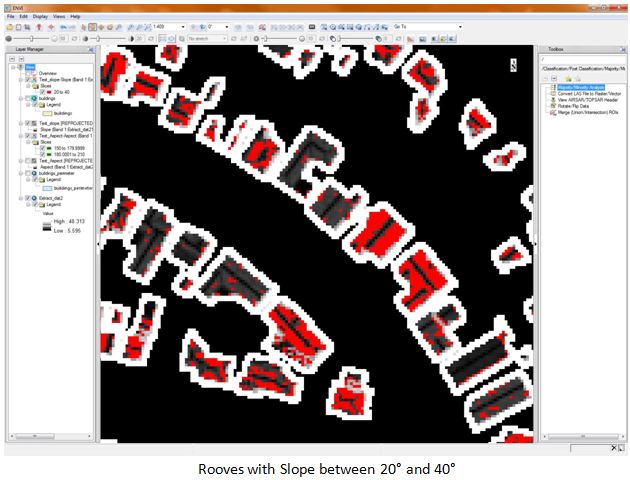
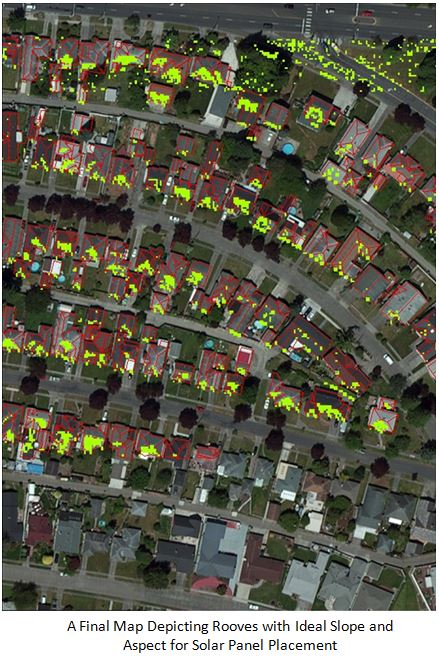
Finally, I was able to combine the two layers to find building rooftops that had both the desired aspect and slope attributes for solar panel placement. I pulled in an imagery basemap layer from Esri to help add context to the analysis.
What this analysis proves is that LiDAR provides an extremely accurate method for collecting the data needed to assess solar panel placement suitability. Software such as ENVI LiDAR and ENVI make it easy to automatically extract information from the point cloud, and to run further analysis on it. As more cities look to solar power to alleviate some of their energy needs, the ability to strategically place solar panels will help ensure that design projects will be successful.
What do you think? Does LiDAR data provide the necessary information to assess solar suitability? What other uses for LiDAR are you seeing in your town?