Using SWIR to Delineate Between Soil and Decaying Canopy Vegetation
Anonym
Short Wave Infrared Data allows an image analyst to "see" beyond what human eye can perceive. This blog assumes a basic knowledge of absorption features and SWIR data. Read this article if you would like a refresher on SWIR data. The range of light that humans can perceive is roughly 400-700 nanometers, an incredibly small range when you look at the whole scope of the electromagnetic spectrum. Analyzing the reflectance of photos in the near infrared and short wave infrared ranges is at the heart of photogrammetry and spectroscopy. We can use SWIR data to understand the health of our plants, but also potentially identify disease vectors, prime harvest time, ensure proper fertilization, etc.
For decades researchers have understood the importance of collecting near-infrared data when analyzing the health of vegetation, but it is only since about the mid-1990s that the research community began working heavily with SWIR data to understand how the surface reflectance can indicate vegetation health, carbon content, nitrogen content, etc. The analysis of SWIR data can be of great use in the fields of agriculture and forestry.
One researcher, Greg Asner, helped improve the understanding of how light interacts with vegetation and how we can use optical imagery to better understand plant health. His paper, Biophysical and Biochemical Sources of Variability in Canopy Reflectance (Asner 1998), helped form a basis of understanding how plants interact with light. He took this further with another paper focused on SWIR data as it applies to vegetation titled: A Biogeophysical Approach for Automated SWIR Unmixing of Soils and Vegetation (Asner and Lobell, 2000). We will dive into just one aspect of this paper and visualize a finding made by Asner and Lobell using ENVI; delineating between senescent vegetation and soil using an absorption feature only present in the SWIR spectral region.
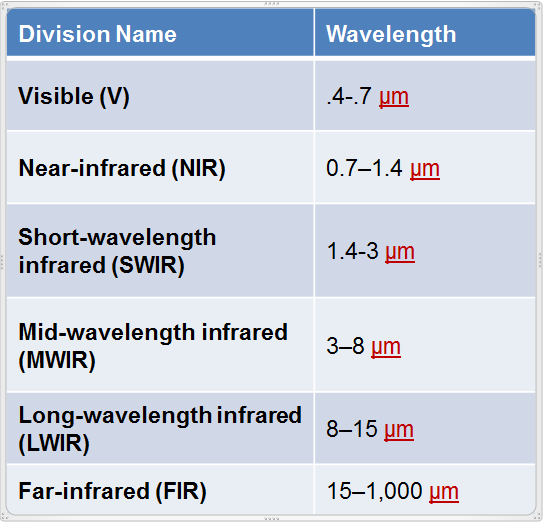
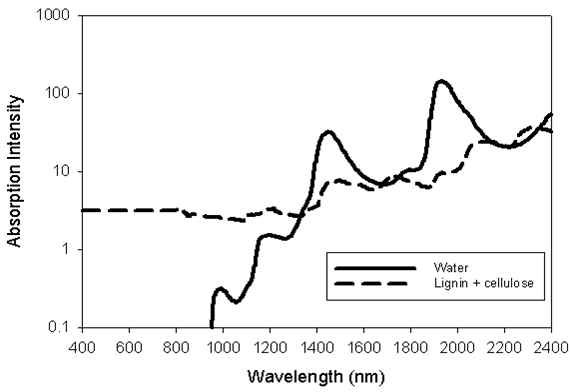
The SWIR range is roughly 1400-3000 nanometers. Historically this range of the EM spectrum has been used for material detection and identification in the fields of minerology, geology and land management. In the late 1990's work improved on identifying specific ranges within the SWIR that can be used to determine vegetative health, water content, carbon content, etc. The figure you see below contains reflectance spectra for water and lignin + cellulose in the visible, near-infrared and short-wave-infrared regions. As you can see, many of the identifiable absorption features are found in the SWIR spectral region.
The visible range of the EM spectrum can be used to identify the pigment of your vegetation. Healthy leafy-plants appear green because of a higher concentration of Chlorophyll a and b, stressed and senescent vegetation appears more yellow because of an increase presence of carotenoids, and vegetation can appear more red because of anthocyanins in newly-forming leaves, which increases with senescence. A great example of using pigment to identify vegetation health and senescence is autumn, when billions of leaves change color from a vibrant green to a yellow/red hue as they decay before dying all-together. Although understanding the pigment of your plant is essential, we cannot identify water content, nitrogen content or carbon content using only the visible range. In the figure below the second plot shows the reflectance of a green leaf, yellow leaf and a red leaf; you can clearly see how the profiles differ depending on the chlorophyll, carotenoid and anthocyanin content.
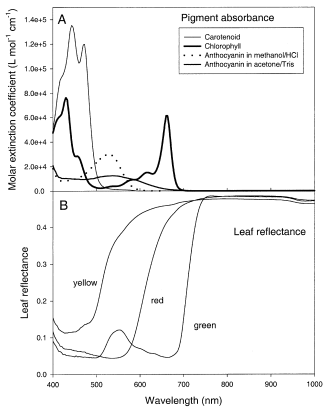
(Plot courtesy of D.A. Sims, J.A. Gamon, Remote Sensing of Environment1)
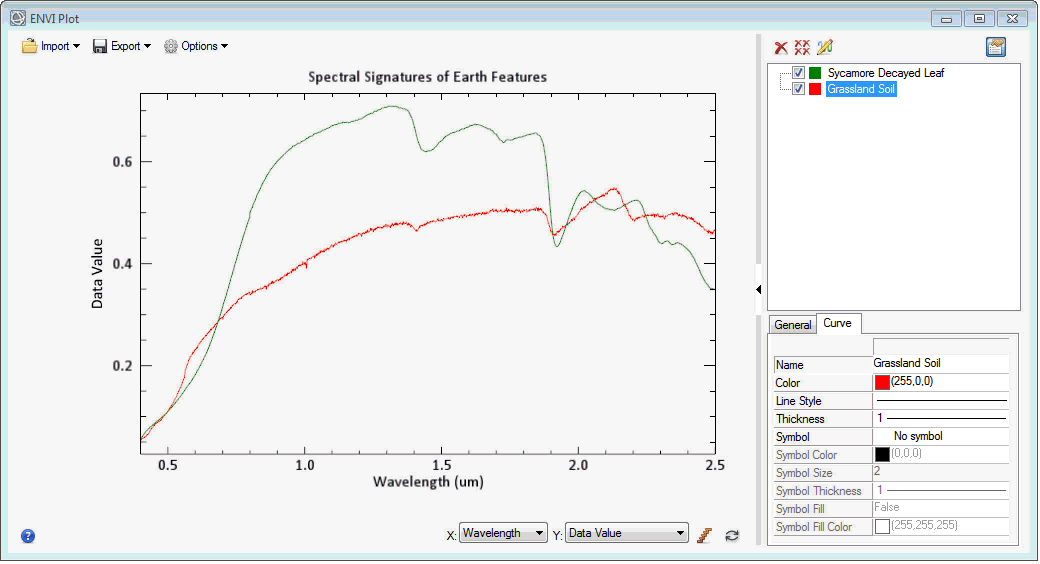
The SWIR range of the EM spectrum allows the user to see certain absorption features very clearly due to certain materials only displaying absorption features in that range, which allows you to determine vegetation health as well as delineate between soil and decaying canopy. As we stated above you can identify the relative health of a plant based off of how green/yellow/red the leaves appear. Looking at a spectral profile comparing decayed leaf spectra and soil in the visible range it is relatively difficult to see the difference in surface reflectance. When you include portions of the SWIR range in the spectral profile the surface reflectance values are clearly different. The top plot shows the mean leaf hemispherical reflectance and transmittance properties collected from sites in the US and Brazil of a woody plant species, and the bottom plot shows reflectance and transmittance for herbaceous species. The plot below shows the increase in absorption features and spectral features present in the SWIR compared to the Visible and NIR range.
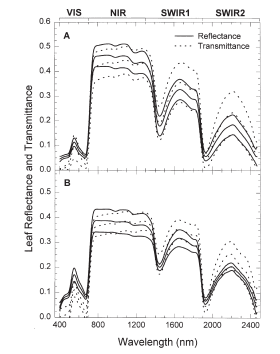
(Plot courtesy of G. Asner, Remote Sensing of Environment2)
According to some of the research performed by Dr. Asner and his colleagues, "soil spectra collected by Asner (1998) had a distinctive absorption feature centered near 2,200 nm, which results from combinations and overtones of hydroxyl absorption in the clay lattice structure of soils that dominate many arid and semi-arid environments." (Asner, 2000). What this means in layman’s terms is that the absorption feature we see in soil surface reflectance at 2,200 nm is due to the presence of clay, and this fact can make it very easy to delineate between soils and decaying canopy. Decaying canopy will have lignin and cellulose while soil will not, and conversely the soil spectra will contain the clay absorption while the decaying canopy spectra will not. Look at the video below to fully understand this concept.
ENVI can easily display spectra from libraries as well as from your own pixel data. Identifying these spectral features and then understanding what causes them is essential to any advanced image analysis workflow. This is but a small demonstration of the power of SWIR data focusing on a single absorption feature. For more information be sure to peruse the many papers published on SWIR data as it applies to vegetation and agriculture.
Watch this webinar focused on using WorldView-3 SWIR data as it pertains to ENVI and vegetation analysis.
Works Cited:
1 - Sims, Daniel A., and John A. Gamon. "Relationships between Leaf Pigment Content and Spectral Reflectance across a Wide Range of Species, Leaf Structures and Developmental Stages." Remote Sensing of Environment 81.2-3 (2002): 337-54. Web. 24 Nov. 2015.
2 - Asner, Gregory P. "Biophysical and Biochemical Sources of Variability in Canopy Reflectance." Remote Sensing of Environment 64.3 (1998): 234-53. Web. 24 Nov. 2015.
3 - Asner, Gregory P., and David B. Lobell. "A Biogeophysical Approach for Automated SWIR Unmixing of Soils and Vegetation." Remote Sensing of Environment 74.1 (2000): 99-112. Web. 24 Nov. 2015.