Viewshed Analysis with LiDAR!
Anonym
What’s the first thing you think when I say, “image exploitation” or “remote sensing feature extraction?” I bet you are thinking about electro-optical data and time tested analytics to tease out information from imagery that is not initially apparent at first glance. That’s great and still very valuable and useful. But lately I’ve had LiDAR on my mind – perhaps because of the uptick I see day-to-day with its availability and use. In fact, just last week I went to the Earth Explorer site to download a sample image and I saw LiDAR collects as available dataset options.
So I was pleasantly side tracked and downloaded a tile to sample these new data offerings. Not only did I find a very respectable point cloud resolution at approximately 3.5 points per square meter, but I also was surprised to see such comprehensive coverage areas! Now that these data are available, what are some of the ways we can exploit the information into usable intelligence products or GIS layers that will provide solutions to some real-world problems?
We already know that extracting features such as buildings, trees, and power lines helps solve problems ranging from biomass estimation of forest stands, proximity analysis of buildings to unhealthy fire-prone vegetation, power line corridor analysis, and other applications. Additionally, LiDAR enables us to very accurately calculate digital surface models (DSMs) and digital elevation models (DEMs) to ascertain topographic information.
Now that we have highly accurate information at our disposal, what types of analytics ingest this type of information to solve real world problems? The first thing that comes to my mind is a Viewshed analysis.
We can first consider things we know about the area including:
- Bare Earth DEM
- DSM (representing features on top of the ground)
- Distance between points
Next we can specify an observer point where we input:
- Location of the observer
- Height of the observer
- Radius of the view area
- Visibility parameters (from any point or common visibility shared between two or more points)
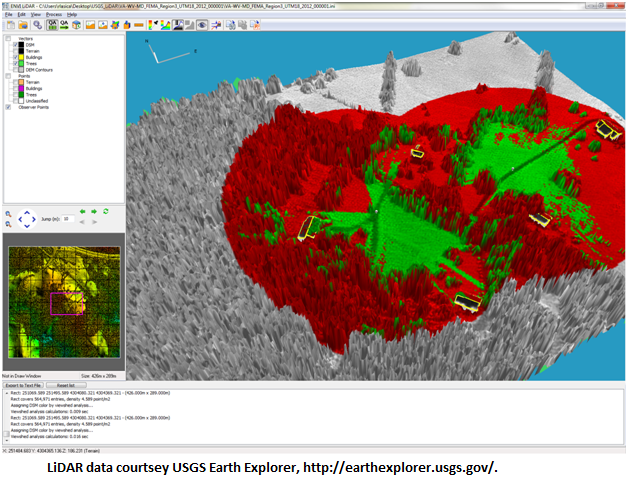
The image below displays one observer point at the fork in the trail of an observer that is 2m tall. Green indicates what the observer can see whereas red indicates obscured areas from that point out to a specified radius (100m).

A second observer is added along the trail to the East. Note that if the two observers are placed as indicated, there is a corridor through the woods that neither can observer can see.
This Viewshed analysis has points selected at regular intervals along the major highway in an effort to determine if can of the clear cut areas are visible from the road. According to the results, the clear cut areas cannot be seen from the road.

I am eager to see applications where Viewshed analysis provides a solution. What other analytics are you planning to perform with LiDAR?