Enhanced Dual Polarization SAR Vegetation Index
Compute an Enhanced Dual Polarization SAR Vegetation Index (EDPSVI) using Dual-Pol data. It estimates the land cover based on the amount of vegetation.
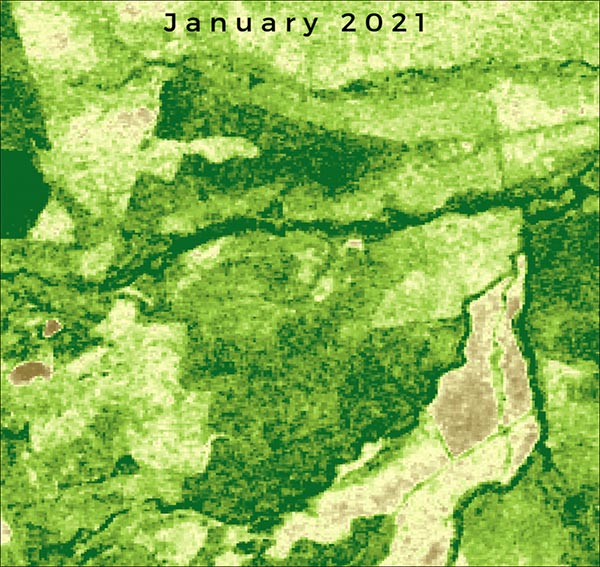
Example of EDPSVI output, this sequence shows how the vegetation density and distribution changes across the year.
Ship Detection – Coastline Extraction
Extract a series of shape files containing the coastline detected in the input images, grouped by tide height.
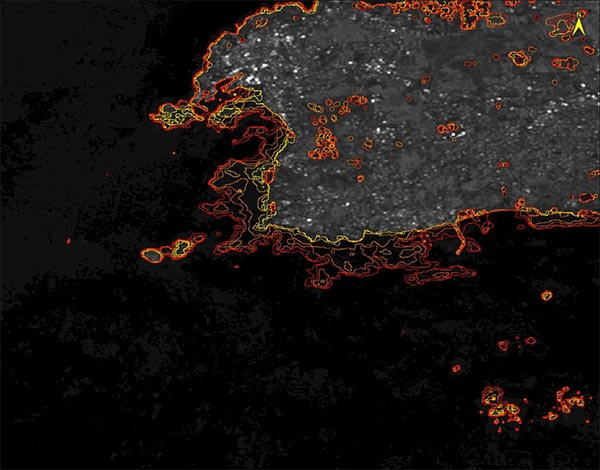
Coastline extraction, different color lines refer to the coastline according to the different tide levels.
DEM extraction with reference height – Images characterized by large areas of sea water can be subjected to geocoding issues due to the different elevation of the sea level within the geoid and the ellipsoid models. This tool is specifically dedicated to geocode intensity SAR data characterized by the presence of sea water.
The increased geocoding precision retrieves the ellipsoidal height by subtracting the geoid component. The main tool that takes advantage of this new features is Ship Detection.
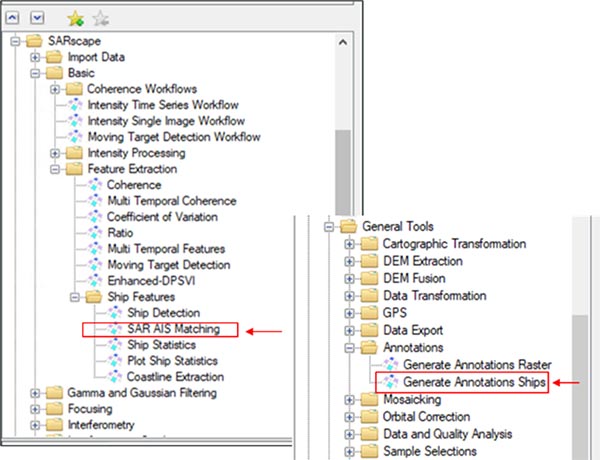
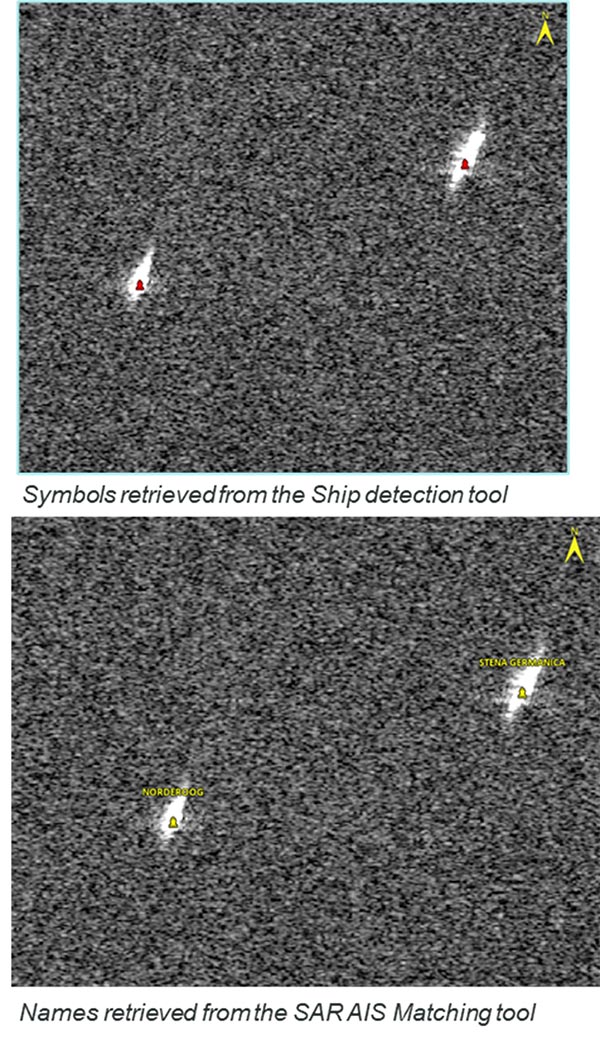
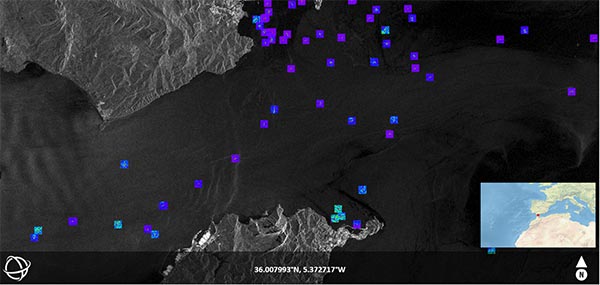
Ship Detection – AIS (Automatic Identification System) Matching and Annotation
The Generate Annotations Ships tool associates a user-specified name to each detected target. It uses the shape file generated by the SAR AIS Matching tool as input.
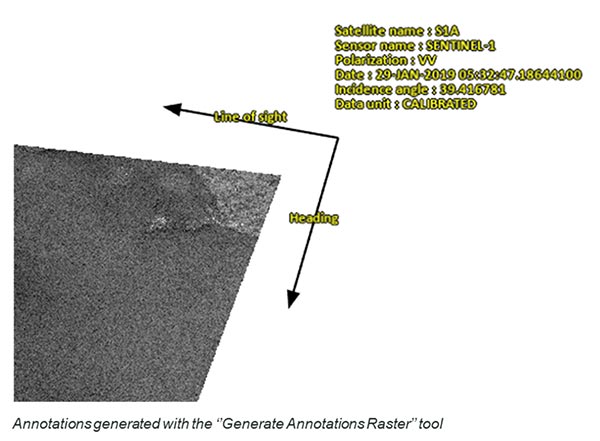
Generate Annotations Raster
Enables the automatic generation of annotations, in the ENVI view, of the geocoded files derived from the following tools:
- Geocoding and Radiometric Calibration
- Phase to Height Conversion and Geocoding
- Phase to Displacement Conversion and Geocoding
- SBAS - Geocoding
- PS - Geocoding
- Ship Detection
- SAR AIS Matching
Other General Tools
Shape Tiler
This tool is used to cut one or multiple shapefiles into tiles of regular size and alignment.
Mosaic Sentinel-1
Mosaic Sentinel-1 Slant Range or Ground Range (e.g. not geocoded) SAR products (_slc_list, _gr) that have been independently imported in ENVI SARscape along the same orbit and with the same viewing geometry.
This functionality is intended to generate a single file, in the original SAR viewing geometry, from a set of independently imported frames. Although this is intended for Slant Range products, it is also suitable for Ground Range data. Data belonging to acquisitions with different time or track are automatically grouped and mosaiced separately.
Displacement Time Series Classification
Phenomenological Analysis – Fits the SBAS raster deformation time series using an external temporal phenomenological magnitude (i.e.: M= temperature, rain, etc).
Parametrical Analysis – Fits the SBAS raster deformation time series using three analytical displacement models (linear, quadratic and sinusoidal).
Both techniques retrieve the best fitting coefficients and its RMS for each pixel in the time series. These coefficients represent different characteristics of the displacement such as speed, acceleration, oscillation amplitude and frequency. These results can be then used to perform a displacement classification using the Classification panel.
Classification – Generate a displacement classification based on the goodness of fitting according to the Akaike criterion. Each class of the classification identifies the areas that better fit the model.
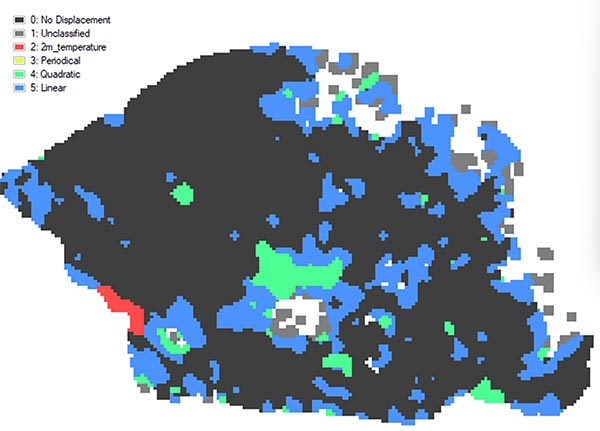
Displacement classification map. The different colors repreent the best fitting trend for a specific criteria.
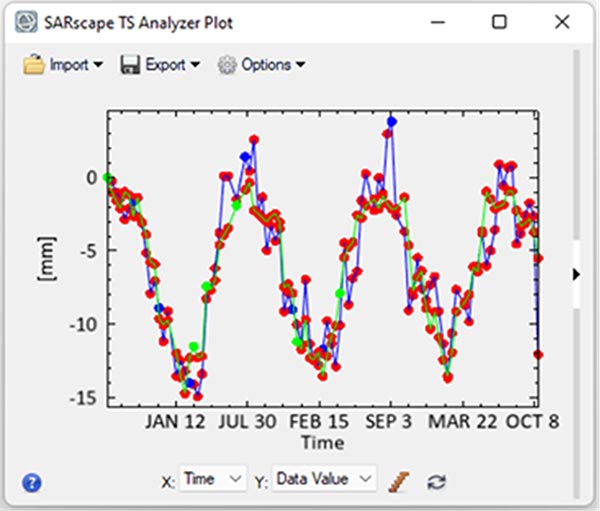
Displacement time series VS temperature time series.
Ship Detection – Classification
Identified ships are classified with a neural network trained on Sentinel-1 data when the input image is polarized VV with a resolution of 10 meters (pixel spacing in range and azimuth). The result of such classification (a vector of probabilities) is saved in the output shape file with a column for each ship type recognized by the neural network.
SAR AIS Matching – Compensation of the doppler effect (moving targets) improves the matching between AIS signal and the detected radar target.
Coherence Matrix Viewer
Displays the coherence images in a matrix format where the row and columns represent the dates considered for the coherence computation.
- Used to analyze the coherence behavior in time series (e.g. Target Detection or growing season for crop monitoring).
- Facilitates the configuration of SBAS parameters (e.g. Connection Graph filtering parameters, First and Second inversion parameters).
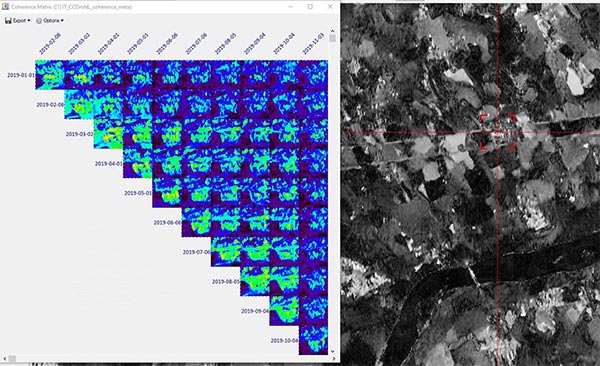
Coherence matrix on the left relevant to the area within the red box; Coherence image on the right
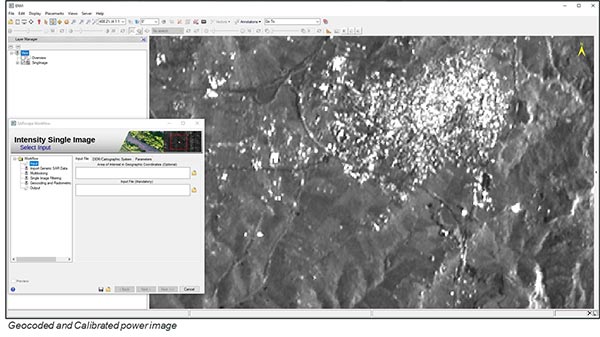
Intensity Single Image Workflow
Generate the geocoded filtered image by executing the following processing sequence in a single iteration:
- Import SAR Data.
- Multilooking.
- Single Image Filtering.
- Geocoding and Radiometric Calibration.
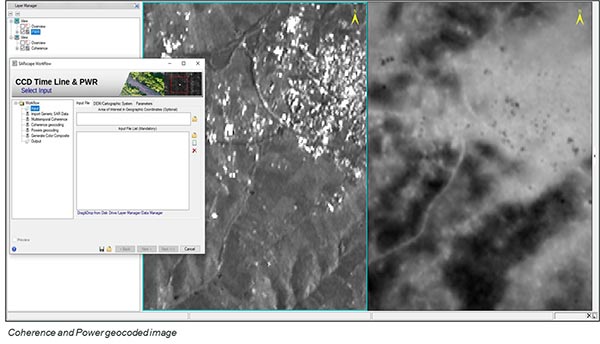
Coherence CCD Time Line & Power Workflow
Generate geocoded power and coherence images by executing the following processing sequence in a single iteration:
- Import Generic SAR Data.
- Multitemporal Coherence (Time Line).
- Coherence Geocoding.
- Powers Geocoding.
- Color Composite Generation.