Counting Whales from Space
Anonym
If you’re a regular reader of this blog you’ll know about the diverse applications of ENVI in environmental monitoring, change detection and the identification and categorization of features, processes and flora at or close to the earth’s surface; from populating geodatabases with bare earth models from LiDAR point clouds to the use of hyperspectral imagery to assess the chemistry and structure of the world's forests and even the use of surveillance technologies such as radar to monitor and bring action against oil polluters in our oceans ENVI has proven credentials and flexibility to answer to different types of challenges. One application area that perhaps receives less coverage but is of growing interest is its use in monitoring earths' fauna.
Following the groundbreaking work of Peter Fretwell and the British Antarctic Survey (BAS) where ENVI was used to double current estimates of emperor penguin populations in Antarctica, the BAS scientists have now turned their attention to the study of Southern Right Whale populations in the Golfo Nuevo on the coast of Argentina. The study published in PLOS One answers to the notoriously difficult challenge of estimating whale populations, a task usually undertaken by costly and oftentimes dangerous manual observation methods. The new approach represents the first successful attempt of the use of satellite imagery to count whales and suggests a transferable methodology which could have far reaching implications for future surveys.
In order to spot the whales the team first manually interrogated a WorldView2 VHR image to retrieve a baseline count from which results from an automated detection approach could be evaluated. The WorldView2 image offers nine bands including eight colour bands at 2M resolution and one panchromatic band at 50cm. Band 5 (termed the coastal band) was especially useful for this task as it collects light at wavelengths between 400nm and 450nm in the blue/violet part of the spectrum which can penetrate water at depths of up to 15M increasing the chances of a positive whale identification. For the visual inspection bands 1 (red), 8 (NIR2) and 5 (coastal) proved to be the most useful positively identifying 55 probable whales.
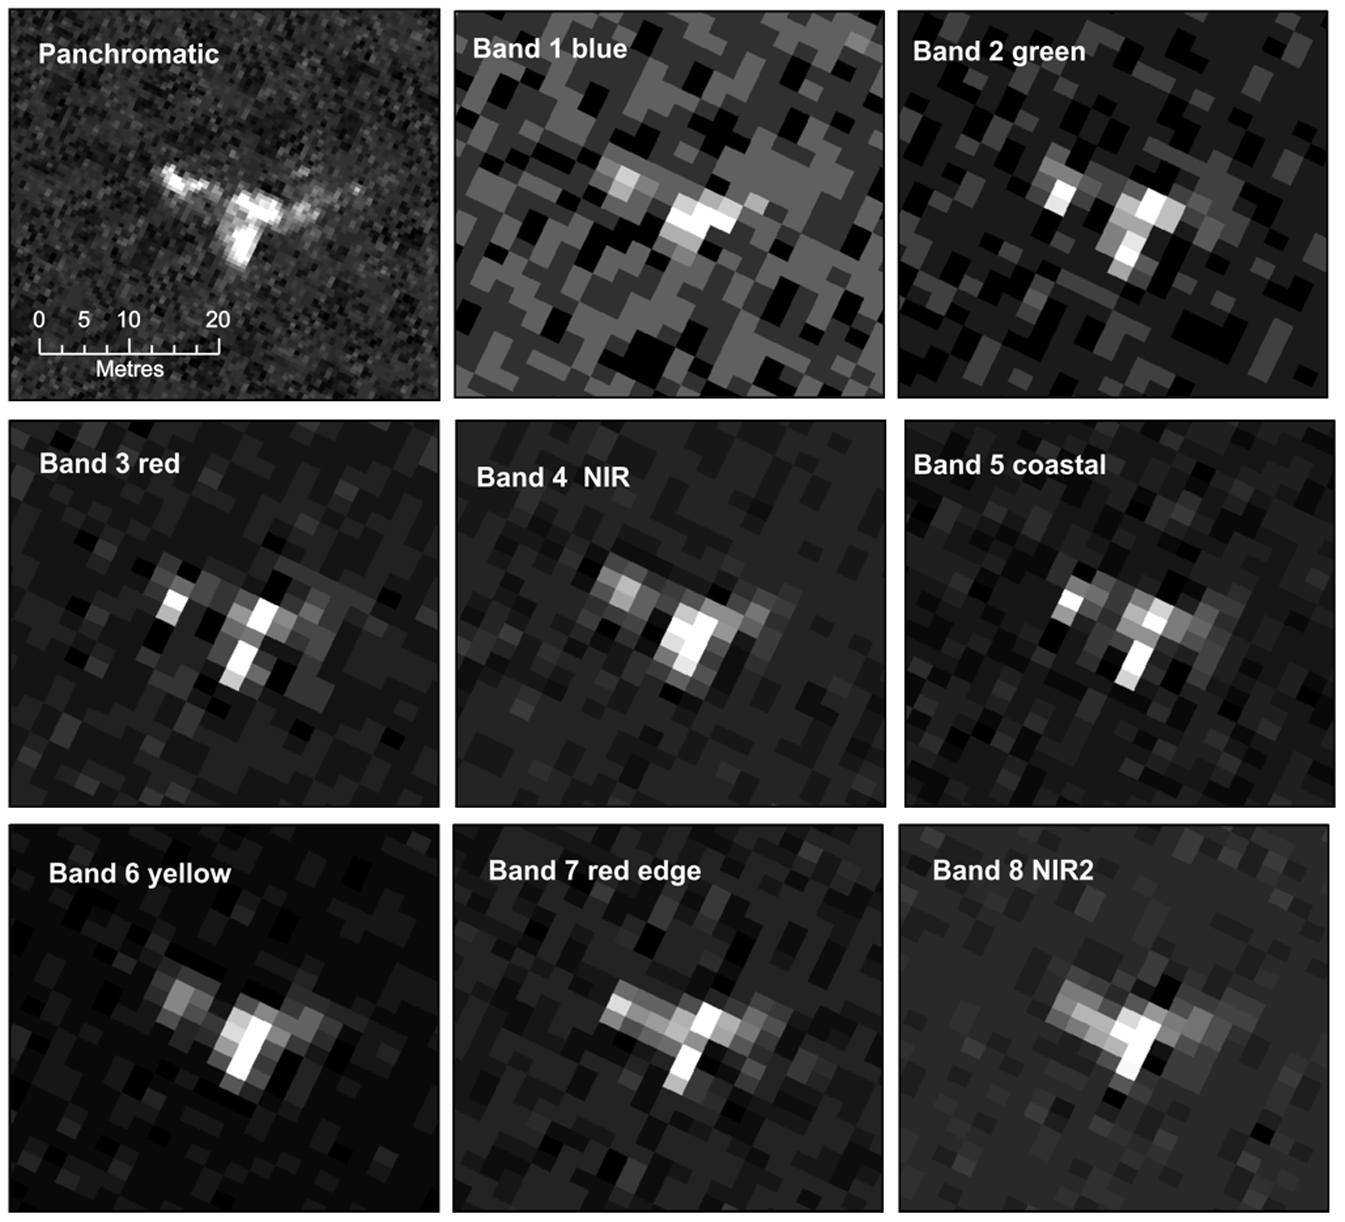
Single band images of a probable right whale in the satellite image from each of the eight multispectral bands and the panchromatic band of the WorldView2 data. Reprinted under a CC BY license with permission from British Antarctic Survey and DigitalGlobe.
Next ENVI 5 was used to automate the process and compare results to the manual identification. Supervised and unsupervised classifications and single band histogram thresholding were trialed with thresholding of the panchromatic and coastal bands delivering the best results confirming 89% of probable whales identified in the manual count.
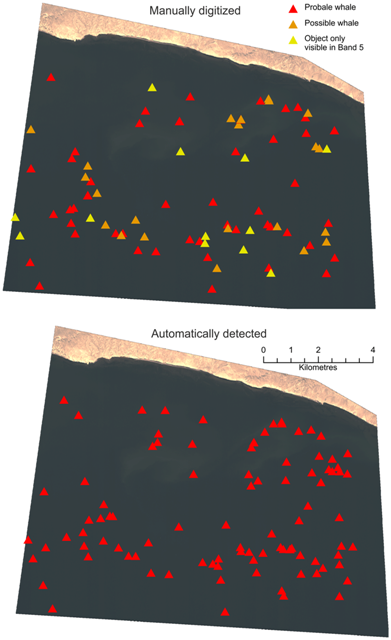
Comparison between manually identified and automatically identified whales.
From what is already a robust set of results the team at BAS identified several ways the approach can be refined to achieve even better accuracies; the use of multiple sets of images to remove false positives generated from objects such as rocks and boats would be straightforward. Placing reflectors below the sea surface would give better insight into how far the satellite sensor is seeing into the water necessary to formulate a ratio of visible whales versus invisible whales from which population estimates could be usefully drawn. Further this study concentrates on pixel-based analysis, object-based analysis which adds spatial, and textural classification techniques such as those employed by ENVI Fx could help to further refine the automated process.
Results from this study are extremely encouraging and point the way to new automated detection methodologies set to revolutionize scientists ability to monitor global whale population dynamics with greater accuracy, frequency and at a reduced cost and risk over traditional methods.