X

NV5 Geospatial Blog

Each month, NV5 Geospatial posts new blog content across a variety of categories. Browse our latest posts below to learn about important geospatial information or use the search bar to find a specific topic or author. Stay informed of the latest blog posts, events, and technologies by joining our email list!


Mapping Earthquake Deformation in Taiwan With ENVI

Mapping Earthquake Deformation in Taiwan With ENVI

12/15/2025

Unlocking Critical Insights With ENVI® Tools Taiwan sits at the junction of major tectonic plates and regularly experiences powerful earthquakes. Understanding how the ground moves during these events is essential for disaster preparedness, public safety, and building community resilience. But traditional approaches like field... Read More >

Comparing Amplitude and Coherence Time Series With ICEYE US GTR Data and ENVI SARscape

Comparing Amplitude and Coherence Time Series With ICEYE US GTR Data and ENVI SARscape

12/3/2025

Large commercial SAR satellite constellations have opened a new era for persistent Earth monitoring, giving analysts the ability to move beyond simple two-image comparisons into robust time series analysis. By acquiring SAR data with near-identical geometry every 24 hours, Ground Track Repeat (GTR) missions minimize geometric decorrelation,... Read More >

Empowering D&I Analysts to Maximize the Value of SAR

Empowering D&I Analysts to Maximize the Value of SAR

12/1/2025

Defense and intelligence (D&I) analysts rely on high-resolution imagery with frequent revisit times to effectively monitor operational areas. While optical imagery is valuable, it faces limitations from cloud cover, smoke, and in some cases, infrequent revisit times. These challenges can hinder timely and accurate data collection and... Read More >

Easily Share Workflows With the Analytics Repository

Easily Share Workflows With the Analytics Repository

10/27/2025

With the recent release of ENVI® 6.2 and the Analytics Repository, it’s now easier than ever to create and share image processing workflows across your organization. With that in mind, we wrote this blog to: Introduce the Analytics Repository Describe how you can use ENVI’s interactive workflows to... Read More >

Deploy, Share, Repeat: AI Meets the Analytics Repository

Deploy, Share, Repeat: AI Meets the Analytics Repository

10/13/2025

The upcoming release of ENVI® Deep Learning 4.0 makes it easier than ever to import, deploy, and share AI models, including industry-standard ONNX models, using the integrated Analytics Repository. Whether you're building deep learning models in PyTorch, TensorFlow, or using ENVI’s native model creation tools, ENVI... Read More >

1345678910Last
6693 Rate this article:
3.5

Determining Trail Conditions Part 2: Trial and User Error

Anonym

Just to give you a little background before we delve into part 2 of my blog series on using remote sensing to determine trail conditions, I would rate my remote sensing skills intermediate at best. I know just enough to be dangerous. I usually work with experts here in our office who generously offer input and advice when I am attempting more advanced image analysis. 

As I set out on my task of finding freely available data for my use case, I quickly realized how tough this task would be for a 4-wheeling club with no funds. I went to USGS’s Earth-Explorer to see what I could pull down for free data for a trail called Webster Pass (below).

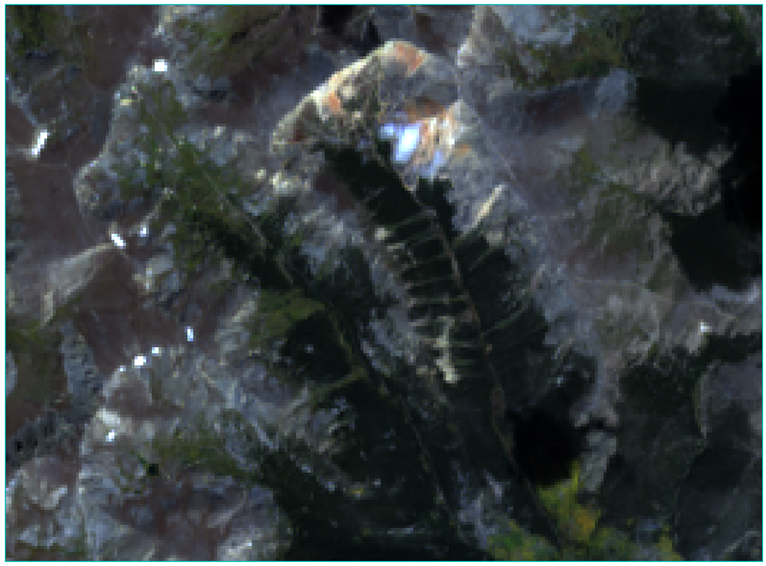
And another trail called Caribou Creek

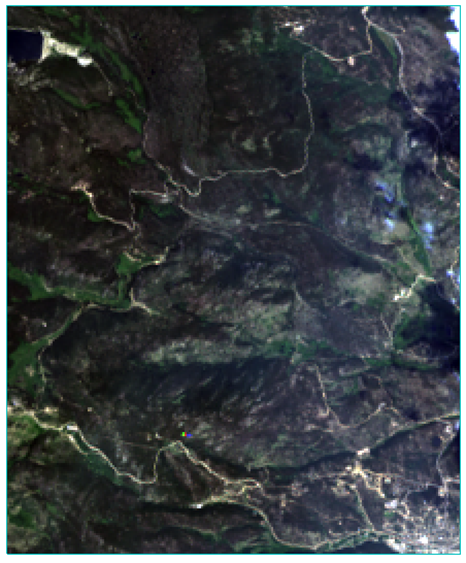
I picked these two trails because I have driven both in various seasons and encountered varying trail conditions. The trails provide two very different landscapes. Webster pass quickly climbs above tree line with mineral rich mountains and barren rock (prone to washing out). Caribou Creek sits in the valley with dense forest and is more prone to standing water, fallen trees, and deep mud pits. After searching in my target areas, both trails were distinguishable from the data sets I pulled down and subsetted,  and I found annual flights over the areas for the comparison piece.

So now I had the data. However, the resolution did not allow me to get to the level where I could pull out features like washed out trails or timbered trees. I tested the Image Change Workflow on both data sets and pulled out features you would expect (large snowfields, leaf on/leaf off changes) but the available resolution didn’t allow me to pull out my focus area -- the trail.

After playing around with free data, I went to some of the experts around me to pick their brains. They were quick to mention several things. First, Landsat would not be optimal for what I wanted to extract. So that was user error 1 – know your data. And secondly, for better results with Landsat I would need to, at minimum, get vectors of the trail systems to overlay and then try and run the change detection from there -- user error 2. 

So based on that, my next step is to track down NAIP data from possible 2011/2014 flights In Colorado which should yield a higher resolution. This option is my best shot for getting accurate results. So now I will go to one of our Data Partners (Airbus or DigitalGlobe) and see what is available for my focus areas. 

I am determined to get this use case right! I will continue on with testing in my spare time and present my findings in Part 3. Stay Tuned.

Please login or register to post comments.