Floodplain mapping for the times -- modeling, mitigation, and preparation
Megan Gallagher
For the third year in a row, the Unites States has faced massive flood damage caused by tropical storms, hurricanes, and heavy continual rainfall over usually dry regions of land. These floods have caused billions of dollars in damage, with over five 1000 years floods occurring in 2018. With the increases in flooding, my interest was peaked on how floodplain maps in many urban areas are created, and how these can help us understand why so much damage has begun to occur.
FEMA (Federal Emergency Management Agency) floodplain mapping is a remote sensing intensive process that is implemented all over the United States. It all starts with a Digital Elevation Model (DEM) -- the higher accuracy the better. What these DEMs allow us to do is get an understanding of slope and terrain. Is there a river, and if so is there a flat expanse of plain around that river? What might be below sea level that is near the mouth of a delta? To get the highest accuracy possible for these DEMs, we turn to remote sensing.
Aerial photography, LiDAR, and even Synthetic Aperture Radar (SAR) can be used to produce medium to high-accuracy DEMs, and each has their own pros and cons. Aerial imagery uses multiple images to create a DEM, and those can be captured using a plane or UAS. However, the quality of aerial imagery is affected by lighting conditions and clouds. LiDAR, which shoots pulses of light and records their response, is an active system. That means it is not affected by lighting conditions, but can only “see” through light haze and clouds. Lastly, SAR is able to see through clouds and at any time day or night, but is one of the most complicated remote sensing systems to work with.
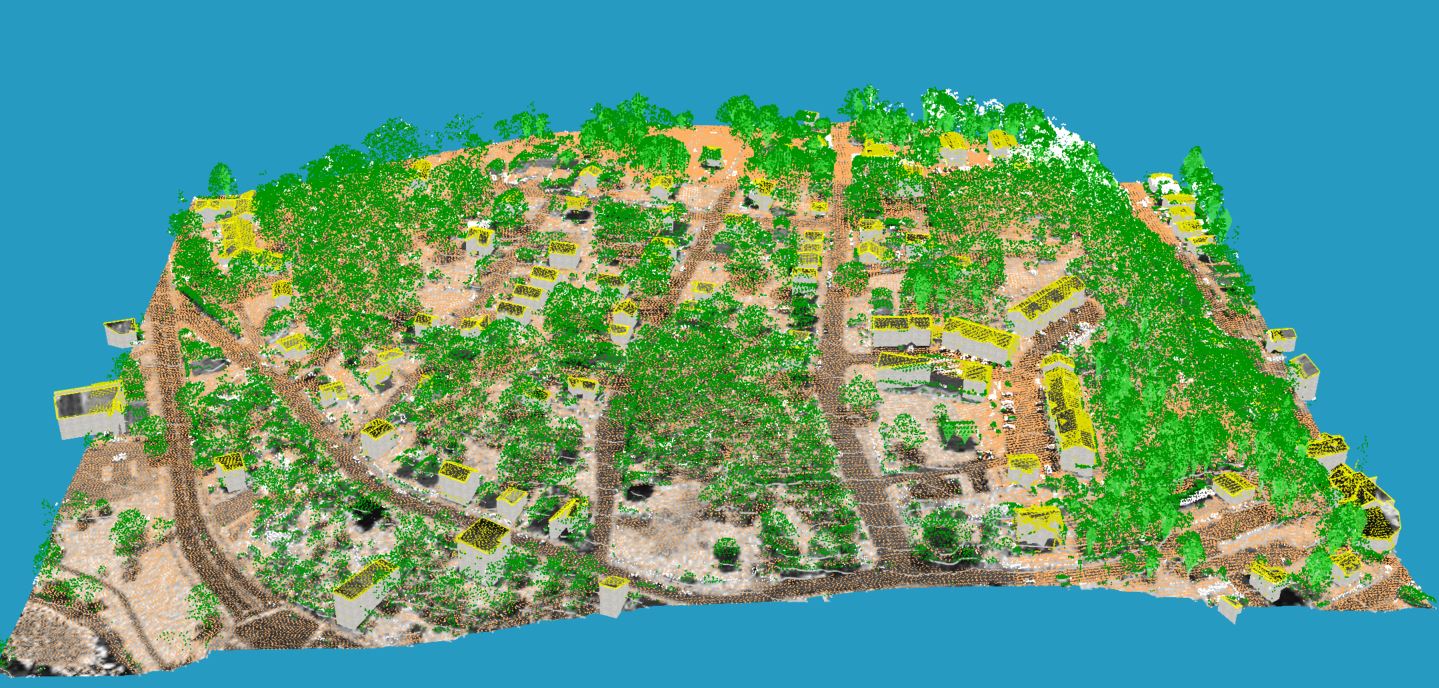
LiDAR output over Norwich, Connecticut. ENVI LiDAR tools were used to classify buildings, power lines, trees, and create a DEM. LiDAR courtesy of Capitol Region Council of Governments. (2016). 2016 Lidar point data. Retrieved from http://cteco.uconn.edu/data/flight2016/index.htm.
With a high-accuracy DEMs and other imagery sources such as satellite, or even UAS imagery, features of importance can be viewed in tandem with how they relate to possible floodplains. Using modern remote sensing we can classify land cover into many different areas of interest, such as low-lying plains, forests, sandy deltas, and urban areas, and then use those classifications to feed into the floodplain modeling. With LiDAR we can also pull out buildings and see where they lie within the possible floodplains. These multiple inputs create a map that shows areas where flooding is a probability. This type of mapping can be used for future modelling, mitigation, and flood preparation.
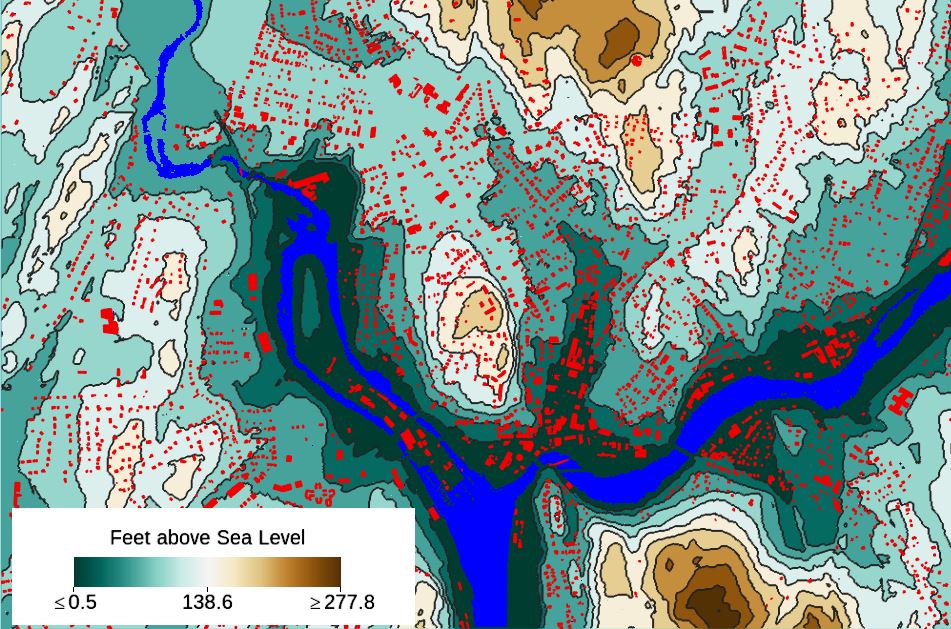
DEM with the Yantic, Thames, and Shetucket rivers (blue) from satellite imagery classification in ENVI. Buildings (red) were found using ENVI LiDAR and you can see how many lie close or within possible flood zones. Norwich flooded in late September 2018, with the Yantic river reaching 12 feet over its normal levels.
If you want to know more about FEMA flood mapping, please go to https://msc.fema.gov/portal/home