X

NV5 Geospatial Blog

Each month, NV5 Geospatial posts new blog content across a variety of categories. Browse our latest posts below to learn about important geospatial information or use the search bar to find a specific topic or author. Stay informed of the latest blog posts, events, and technologies by joining our email list!


Mapping Earthquake Deformation in Taiwan With ENVI

Mapping Earthquake Deformation in Taiwan With ENVI

12/15/2025

Unlocking Critical Insights With ENVI® Tools Taiwan sits at the junction of major tectonic plates and regularly experiences powerful earthquakes. Understanding how the ground moves during these events is essential for disaster preparedness, public safety, and building community resilience. But traditional approaches like field... Read More >

Comparing Amplitude and Coherence Time Series With ICEYE US GTR Data and ENVI SARscape

Comparing Amplitude and Coherence Time Series With ICEYE US GTR Data and ENVI SARscape

12/3/2025

Large commercial SAR satellite constellations have opened a new era for persistent Earth monitoring, giving analysts the ability to move beyond simple two-image comparisons into robust time series analysis. By acquiring SAR data with near-identical geometry every 24 hours, Ground Track Repeat (GTR) missions minimize geometric decorrelation,... Read More >

Empowering D&I Analysts to Maximize the Value of SAR

Empowering D&I Analysts to Maximize the Value of SAR

12/1/2025

Defense and intelligence (D&I) analysts rely on high-resolution imagery with frequent revisit times to effectively monitor operational areas. While optical imagery is valuable, it faces limitations from cloud cover, smoke, and in some cases, infrequent revisit times. These challenges can hinder timely and accurate data collection and... Read More >

Easily Share Workflows With the Analytics Repository

Easily Share Workflows With the Analytics Repository

10/27/2025

With the recent release of ENVI® 6.2 and the Analytics Repository, it’s now easier than ever to create and share image processing workflows across your organization. With that in mind, we wrote this blog to: Introduce the Analytics Repository Describe how you can use ENVI’s interactive workflows to... Read More >

Deploy, Share, Repeat: AI Meets the Analytics Repository

Deploy, Share, Repeat: AI Meets the Analytics Repository

10/13/2025

The upcoming release of ENVI® Deep Learning 4.0 makes it easier than ever to import, deploy, and share AI models, including industry-standard ONNX models, using the integrated Analytics Repository. Whether you're building deep learning models in PyTorch, TensorFlow, or using ENVI’s native model creation tools, ENVI... Read More >

1345678910Last
18323 Rate this article:
5.0

Gearing up for Big Weather Data

Anonym

In the next few years there are some very exciting weather sensors being launched. NOAA’s weather work horse system, GOES, will get a new instrument GOES-R that will greatly improve the temporal, spectral,and spatial resolution of the weather imagery that gets used to make forecasts,watches and warnings. The Advanced Baseline Imager is the primary imaging instrument on GOES-R and built by our parent company, Exelis Inc. There is a similar system called the Advanced Himawari Imager (AHI) on Himawari-8 which is Japan’s weather satellite that launched last year. See the table below forABI’s improvements over the legacy GOES system.

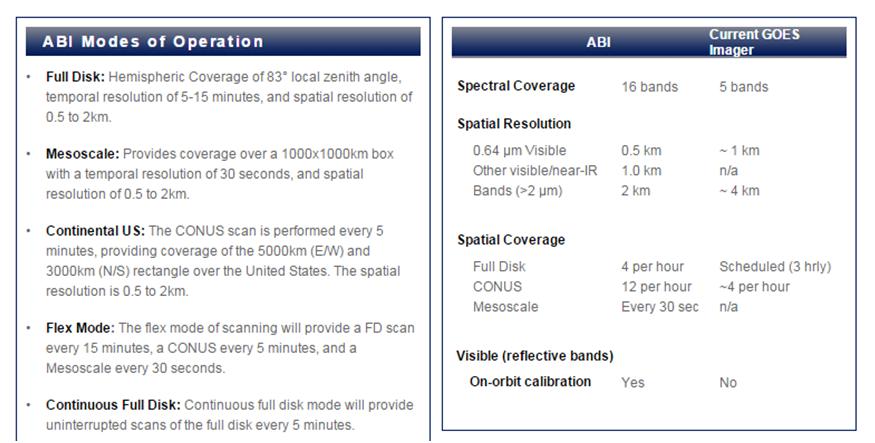
GOES-R ABI facts from https://www.goes-r.gov/spacesegment/abi.html

The Mesoscale mode for imaging is a huge boon to severe weather forecasters. Getting imagery every 30 seconds of a hurricane or tornadic system will provide much greater forecasting detail as well as the ability to forensically model events. See image below showing kinds information more frequent imaging can provide.

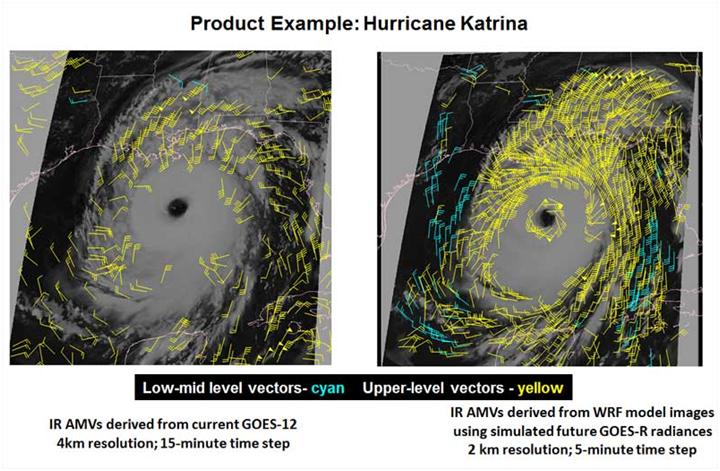
https://www.goes-r.gov/spacesegment/abi-improvements.html

In ENVI 5.2 we released a raster series tool that did a great job telling stories about change in imagery. You could animate over one spot or through entire pass of Landsat data. For the casual remote sensing user it got the job done very well. Recently working with a weather customer, we found that animating through GOESimagery at a rate that you would see on the weather report or on a weatherwebpage with GOES imagery at full resolution (~1km pixel for the visiblechannel, 16,000 x 7,000 pixels) was taking a little longer to animate and loadthan we’d like. So our engineering team took the challenge and made some changes. The animation below shows the increased speed.  

You are able to annotate and draw ROIs in ENVI while the image is animating, so imagine the type of information you extract while you’re animating—things that are changing. Things where you need the animation to see the change like a smoke plume, water turbitiy, geomorphology, or sea ice movement. Think of classifying features with the added temporal element. World vectors that come with ENVI can be overlaid, but also more local vectors, like home or property locations, so one can see areas being impacted by severe weather. Videos of the animation can be created and shared, all at full resolution. When weather data in the US takes a huge leap forward with GOES-R and ABI, ENVI will be ready to ingest the larger data volumes and provide animation and analysis support tools to go with that data.

Follow me on twitter @asoconnor

Please login or register to post comments.