Image Analysis in New and Diversified Industries
Anonym
New applications for image analysis techniques are being discovered at an ever-increasing rate. The advancement of image analysis into new and diversified industries is being driven in part by the realization that remotely sensed data provides highly accurate and timely delivery of the information necessary to run operations as efficiently as possible. Another key component to the growth of image analysis in new and diversified industries is the ever increasing availability of high resolution remotely sensed data. There are now several commercial companies, including Maxar (formerly DigitalGlobe) and Airbus Defence & Space® , which provide satellite imagery with a spatial resolution of a half meter (or less) per pixel. We are also beginning to see the emergence of an Unmanned Aircraft Systems (UAS) market.
As more high resolution data becomes available, costs will naturally decrease, allowing for data to be acquired by individuals and organizations that may not have previously considered image analysis as an economically viable option to increasing operating efficiency. These industries include (but are certainly not limited to) agriculture, mining, logging, urban planning, and oil & gas. What high resolution data can provide these industries is a new way of looking at on-the-ground conditions. Automated workflows can be created which take imagery from data ingest, through image analysis, to the generation of reports which can include maps, charts, and graphs. This information can be vital to improving things such as environmental management of job sites and overall production yield.
Let's take a quick look at an example of how high resolution imagery can be used to help manage crop yield. In this example, we will be looking at vineyards in Napa Valley, California. The imagery we will be using is from the Pléiades system from Airbus Defense & Space®. With a spatial resolution of approximately a half meter per pixel, we can take a very close look at the health of crops. The image below was captured on June 30, 2014, and shows several vineyards in Color Infrared (CIR). By looking at the image, we can gain a quick understanding of where grape vines are growing and where they are most healthy by observing which areas are most saturated with red.
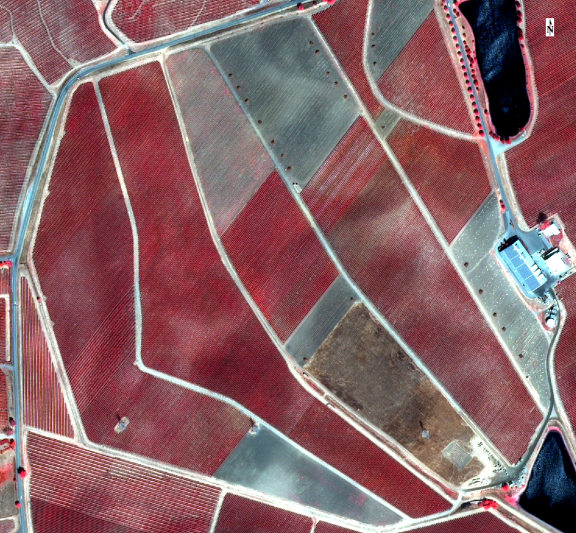
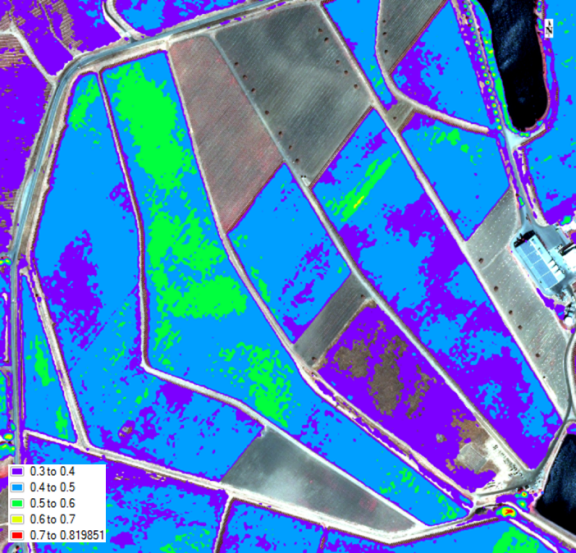
Image analysis allows us to not only qualitatively observe this information, but to quantify it. By applying any of a number of spectral indices we can look at phenomena such as overall vegetation health, water content, and soil content. This information can be combined to determine the best methods for boosting productivity. The image below shows how a vegetation index, in this case the Green Difference Vegetation Index (GDVI), can be used to quantify vegetation health and delineate areas that are doing well vs. areas that might be of concern.
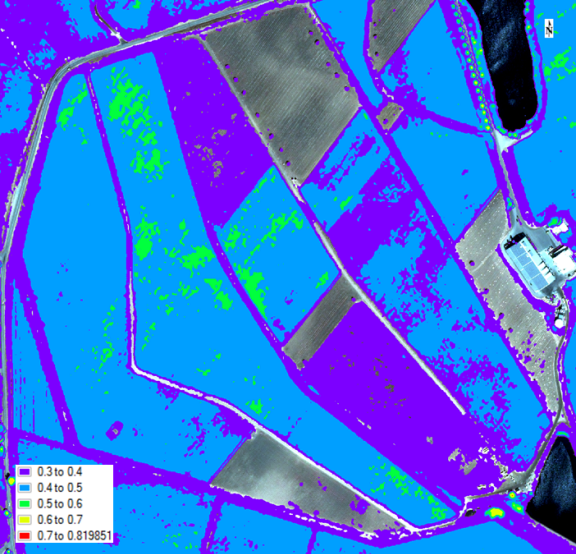
With this information at hand, growers can modify operations to correct for growth inconsistencies. With the rapid revisit times offered by today's commercial satellites and the potential of the UAS market to provide fast and cheap acquisition of new imagery, operations can be monitored on a regular basis to ensure optimum productivity. The image below shows the same area with analysis performed on an image captured on September 10, 2014.
The ability to monitor production areas and obtain continuous information about on-the-ground conditions gives remotely sensed data a clear advantage over more traditional discrete methods of geographic data collection. Image analysis using high resolution imagery provides an easy way to add scientifically proven data analysis techniques to industry practices that will increase production efficiency, cut costs, and reduce the chances of failing to meet environmental regulations.