Improving Visibility - Understanding LiDAR Viewsheds
Anonym
.jpg)
* Image used courtesy of Wikimedia
Last week I was speaking to a gentleman at the SPAR International 2015 conference in Houston, Texas who was trying to conduct a series of viewshed analyses using LiDAR to assess how much of an area could be seen from certain vantage points within their area of interest. His problem was that the software package he was using only took into account the Digital Elevation Model, or DEM, as opposed to leveraging the Digital Surface Model, or DSM, that was also available within the point cloud. Basically, when he got to the area where he had conducted his analysis he would find there was a tree, a building, or some object obstructing his view.
What he needed was an algorithm that took into account not only the height of the observer, but the height of their objects around the observer as well. Below is a screenshot of a general viewshed analysis in ENVI LiDAR, which automatically sets the height of the observer to 2 meters above the surface of the Earth, or DEM value.
Notice how the viewshed takes into account the surface of the not only the ground, but of the trees or other objects as well. This is done by building a Digital Surface Model that incorporates all of the points in the cloud to determine what can be seen from a given spot. When an observer point is created, the user also has the option to adjust the height of the observer, to model someone who may be in a tower, up in a tree, or raised above the ground by some other means.
For this point, I've raised the observer up to a height of 17 meters, which results in the viewshed below. Note how the area visible to the observer has improved due to the increased height which allows them to see over the tops of some of the trees in the area.
Aside from height, there are a number of other properties that can be altered to allow for more advanced viewshed analysis. These include the ability to set the radius of the observer's view, the ability to change the color of visible vs. non-visible areas, and the ability to set the azimuth, pitch, and horizontal and vertical field of view. It also contains the ability to set the DSM resolution, and to toggle on and off range rings at a user-specified difference.
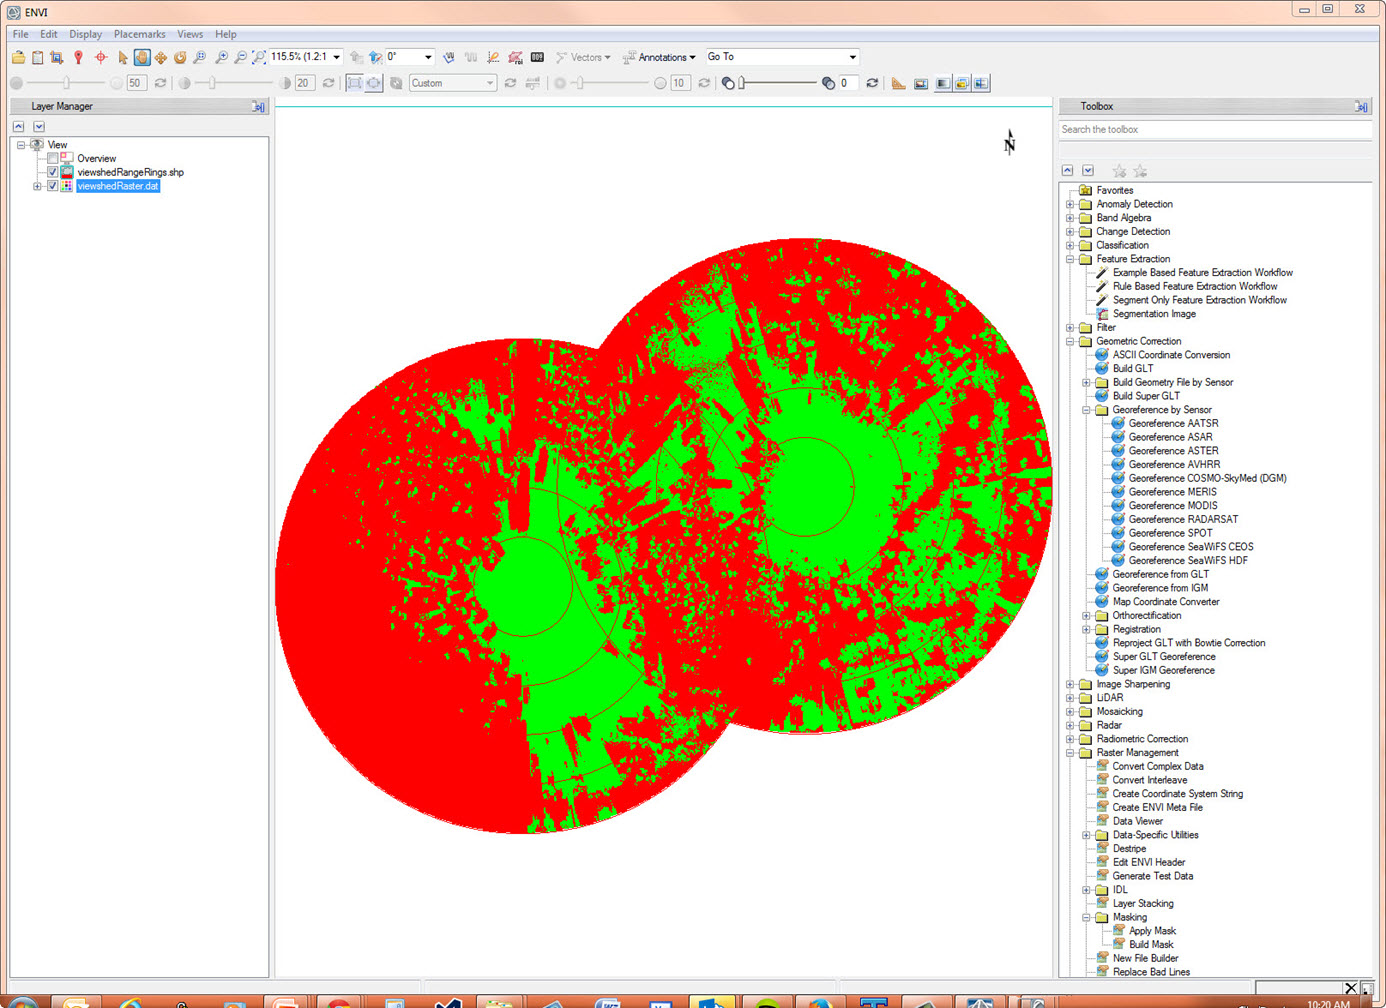
A user can also create multiple observers within a scene, which enables the assessment of visible coverage for an area from multiple points. This can be very useful from surveillance or security standpoint. The observer settings can also be modified to show only areas that are visible by all observers, or areas that are visible by any observer.
Finally, all of this information can be transported over to a software such as ENVI or ArcGIS® with a single click for further analysis to calculate information such as area covered or to better understand similarities or differences between observers points.
It's important for geospatial analysis to reflect real world situations. Simple oversights in our understanding of geospatial problems can result in misleading information that can waste the time and resources of the organizations that are using specific solutions in their day-to-day workflows. Spending the time to truly incorporate all of the relevant factors into a solution can go a long way towards increasing the efficiencies of those organizations and teams. After showing this to the gentleman I met at SPAR, he was very excited that he'd never have to go visit a misidentified location again!
*By Virginia State Parks staff (Leesylvania State Park Uploaded by AlbertHerring) [CC BY 2.0 (http://creativecommons.org/licenses/by/2.0)], via Wikimedia Commons