X

NV5 Geospatial Blog

Each month, NV5 Geospatial posts new blog content across a variety of categories. Browse our latest posts below to learn about important geospatial information or use the search bar to find a specific topic or author. Stay informed of the latest blog posts, events, and technologies by joining our email list!


Not All Supernovae Are Created Equal: Rethinking the Universe’s Measuring Tools

Not All Supernovae Are Created Equal: Rethinking the Universe’s Measuring Tools

6/3/2025

Rethinking the Reliability of Type 1a Supernovae   How do astronomers measure the universe? It all starts with distance. From gauging the size of a galaxy to calculating how fast the universe is expanding, measuring cosmic distances is essential to understanding everything in the sky. For nearby stars, astronomers use... Read More >

Using LLMs To Research Remote Sensing Software: Helpful, but Incomplete

Using LLMs To Research Remote Sensing Software: Helpful, but Incomplete

5/26/2025

Whether you’re new to remote sensing or a seasoned expert, there is no doubt that large language models (LLMs) like OpenAI’s ChatGPT or Google’s Gemini can be incredibly useful in many aspects of research. From exploring the electromagnetic spectrum to creating object detection models using the latest deep learning... Read More >

From Image to Insight: How GEOINT Automation Is Changing the Speed of Decision-Making

From Image to Insight: How GEOINT Automation Is Changing the Speed of Decision-Making

4/28/2025

When every second counts, the ability to process geospatial data rapidly and accurately isn’t just helpful, it’s critical. Geospatial Intelligence (GEOINT) has always played a pivotal role in defense, security, and disaster response. But in high-tempo operations, traditional workflows are no longer fast enough. Analysts are... Read More >

Thermal Infrared Echoes: Illuminating the Last Gasp of a Dying Star

Thermal Infrared Echoes: Illuminating the Last Gasp of a Dying Star

4/24/2025

This blog was written by Eli Dwek, Emeritus, NASA Goddard Space Flight Center, Greenbelt, MD and Research Fellow, Center for Astrophysics, Harvard & Smithsonian, Cambridge, MA. It is the fifth blog in a series showcasing our IDL® Fellows program which supports passionate retired IDL users who may need support to continue their work... Read More >

A New Era of Hyperspectral Imaging with ENVI® and Wyvern’s Open Data Program

A New Era of Hyperspectral Imaging with ENVI® and Wyvern’s Open Data Program

2/25/2025

This blog was written in collaboration with Adam O’Connor from Wyvern.   As hyperspectral imaging (HSI) continues to grow in importance, access to high-quality satellite data is key to unlocking new insights in environmental monitoring, agriculture, forestry, mining, security, energy infrastructure management, and more.... Read More >

1345678910Last
19385 Rate this article:
3.3

In a Word: Change

Anonym

We hear it every day, change is coming.  Faster, slower, or going in circles, it is the biggest constant in our world. I discovered a couple things that are already in ENVI, or coming soon, that makes understanding imagery and change much more palatable.


1) All the vector data and base imagery data available in 5.1


I opened up some cloudy NPP VIIRS data and was pretty flummoxed as to where in the world I found myself. 

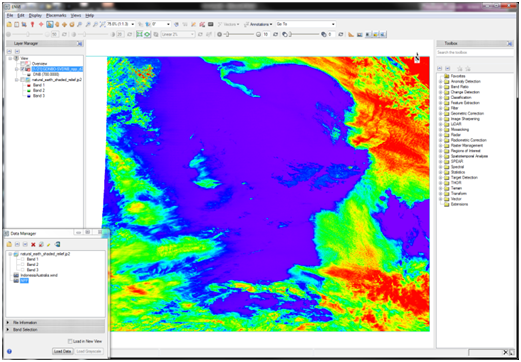
Hmmmm, where am I???


As of 5.1, I can now go to File->Open WorldData->Shaded Relief et viola! Having a map to show your basis of change is really helpful!


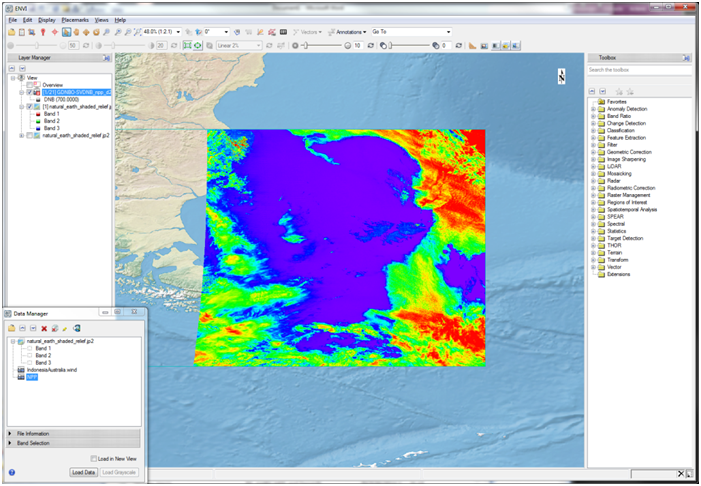
2) Time series tools, coming this fall!


ENVI will be time aware. It’s coming and it’s being tested right now, so I’m lucky enough to have a sneak peak. Past options included layer stacking or using IDL to extract temporal trends for analysis. The layer stack approach required you to have the same area and designate a pixel size for all data. It worked, but wasn’t terribly flexible for images of different spatial extents. There are many imaging systems now acquiring data daily, or even more frequently, and there is a need for more comprehensive change tools for these datasets. Check out this animation of wind data found in a GRIB file. Again, the world data gives me context, the multiple views allows me to visually compare winds from the north/south and east/west, and the time slider makes it easy to step through data, annotate and create a video.


3) Change detection tools


The change detection workflow that came out in ENVI 4.8 is still one of my favorite features. You can go cross-eyed trying to visually find vegetation changes like in these NAIP images from 2009 and 2010.


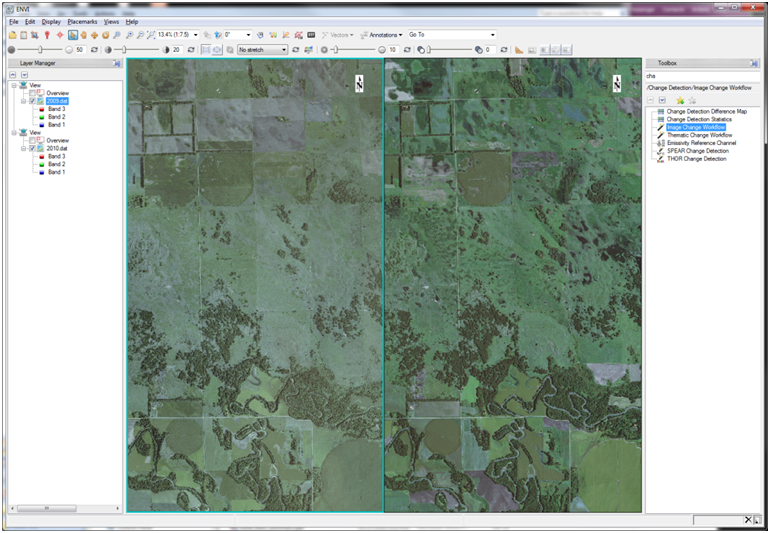
But with image differencing, you can quantify the changes, export to a shape file and quickly find areas that are of interest. In this case, I was looking for vegetation decrease, especially native prairie vegetation. A change in prairie vegetation can be a new claim or it can be illegal activities such as misuse of subsidies. Using change detection, I’m able to quickly highlight decreases in vegetation from 2009 to 2010—ENVI computes an NDVI if there is a Near-Infrared band and then performs the change detection on the two NDVI products. Some of these changes are seasonal differences and different crops, but at least now you have a place to start instead of looking at a whole scene and being overwhelmed. There was always this capability with ENVI’s bandmath, but you had to have the exact same image dimensions, which is an extra step that was never one of my favorites. The image change tool just takes care of those details, gives you a preview window at each step and generally saves a ton of time.


What are the biggest change challenges in your work? Extremetime series? Befores and afters? Change detection using different sensors? Bring it on, I’d love to hear your stories!


Please login or register to post comments.