X

NV5 Geospatial Blog

Each month, NV5 Geospatial posts new blog content across a variety of categories. Browse our latest posts below to learn about important geospatial information or use the search bar to find a specific topic or author. Stay informed of the latest blog posts, events, and technologies by joining our email list!


NV5 at ESA’s Living Planet Symposium 2025

NV5 at ESA’s Living Planet Symposium 2025

9/16/2025

We recently presented three cutting-edge research posters at the ESA Living Planet Symposium 2025 in Vienna, showcasing how NV5 technology and the ENVI® Ecosystem support innovation across ocean monitoring, mineral exploration, and disaster management. Explore each topic below and access the full posters to learn... Read More >

Monitor, Measure & Mitigate: Integrated Solutions for Geohazard Risk

Monitor, Measure & Mitigate: Integrated Solutions for Geohazard Risk

9/8/2025

Geohazards such as slope instability, erosion, settlement, or seepage pose ongoing risks to critical infrastructure. Roads, railways, pipelines, and utility corridors are especially vulnerable to these natural and human-influenced processes, which can evolve silently until sudden failure occurs. Traditional ground surveys provide only periodic... Read More >

Geo Sessions 2025: Geospatial Vision Beyond the Map

Geo Sessions 2025: Geospatial Vision Beyond the Map

8/5/2025

Lidar, SAR, and Spectral: Geospatial Innovation on the Horizon Last year, Geo Sessions brought together over 5,300 registrants from 159 countries, with attendees representing education, government agencies, consulting, and top geospatial companies like Esri, NOAA, Airbus, Planet, and USGS. At this year's Geo Sessions, NV5 is... Read More >

Not All Supernovae Are Created Equal: Rethinking the Universe’s Measuring Tools

Not All Supernovae Are Created Equal: Rethinking the Universe’s Measuring Tools

6/3/2025

Rethinking the Reliability of Type 1a Supernovae   How do astronomers measure the universe? It all starts with distance. From gauging the size of a galaxy to calculating how fast the universe is expanding, measuring cosmic distances is essential to understanding everything in the sky. For nearby stars, astronomers use... Read More >

Using LLMs To Research Remote Sensing Software: Helpful, but Incomplete

Using LLMs To Research Remote Sensing Software: Helpful, but Incomplete

5/26/2025

Whether you’re new to remote sensing or a seasoned expert, there is no doubt that large language models (LLMs) like OpenAI’s ChatGPT or Google’s Gemini can be incredibly useful in many aspects of research. From exploring the electromagnetic spectrum to creating object detection models using the latest deep learning... Read More >

1345678910Last
«September 2025»
SunMonTueWedThuFriSat
31123456
78910111213
14151617181920
21222324252627
2829301234
567891011
21717 Rate this article:
No rating

Let it Snow, Let it Snow...

Anonym

I’ll be the first to admit that amidst my complaints about the cold and frosty winter air, the 10.5 inches of new snow in my backyard over the weekend was more than beautiful and offered a welcome change of scenery, not to mention an inviting cup of hot chocolate after sledding with the kids. So, with another storm on its way to Colorado and three more positioned to hit the East coast this week, I thought I would look into some fun maps and practical applications related to remote sensing and snowfall.

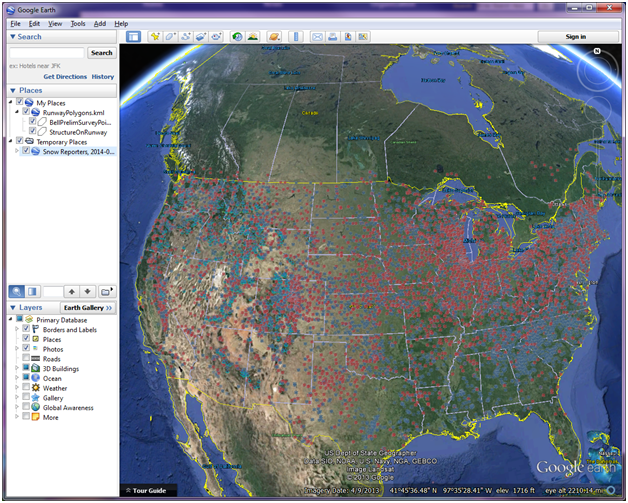
One of my favorite applications is on the National Operational Hydrologic Remote Sensing Center (NOHRS) page on the NOAA site. It combines 3D mapping with additional data layers to paint a picture of snowfall amounts across the US. I expected to see some oblong shapes over the Western mountains and along the Northeast similar to the shape of the jet stream pictures we see every day on the news. Instead, I was shocked to find that there has been measurable snow in every state of the continental US in the past few days!

With all the recent snowfall, another obvious remote sensing application that came to mind was spring flooding, using airborne surveys for flood forecast modeling. NOAA does a great job creating such models and compiling relevant data that are based on Snow Water Equivalent(SWE) and soil moisture contents as measured by the NOAA Airborne Snow Survey Program. A detailed user guide outlining steps that go into this modeling is published on the site, and by page 2 you will hit some heavy-duty math.

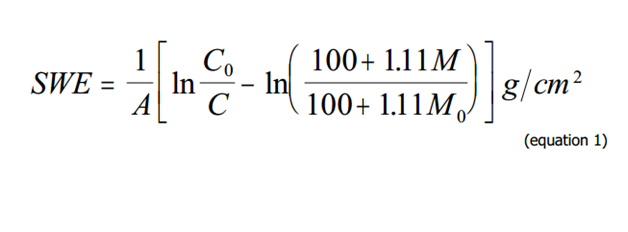
But if you read on, you might agree that there are some pretty interesting factors that go into flood modeling, and remote sensing has a very well suited role.

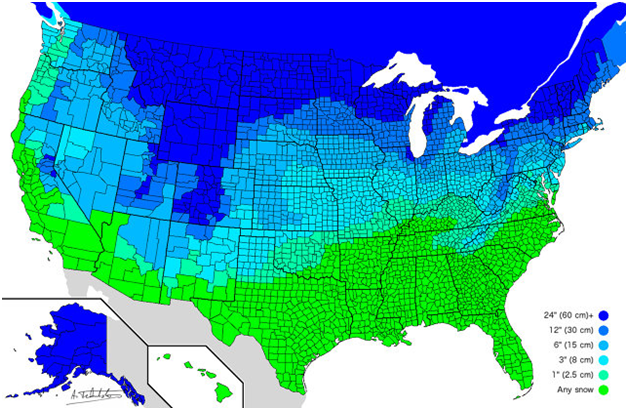
Perhaps on a lighter note, and pretty exciting to pass along to the kiddos ahead of the coming storms is this “How many inches will it take to close my school” map courtesy of Redit editor atrubetskoy:

I would love to hear about the winter-related remote sensing applications you are working on this year!

Please login or register to post comments.