Leveraging the Spatial, Spectral, and Temporal Value of a New WorldView
Anonym
A lot of people may not know it, but Exelis Inc. has designed the optical components for every single satellite that DigitalGlobe™ Inc. has in its constellation today. This includes QuickBird, WorldView 1, 2, 3, and 4, as well as IKONOS and GeoEye1. This gives us a unique ability to incorporate sensor-specific camera models into our software to more accurately extract information from DigitalGlobe data.
ENVI takes advantage of unique characteristics of DigitalGlobe data in order to answer geospatial questions and to solve problems. Three of these characteristics that I'd like to cover in this blog are spatial, spectral, and temporal.
All of DigitalGlobe's satellites capture imagery at better than 1 meter resolution, with many of them capturing data at better than 50cm resolution. A recent relaxation of operating restrictions on DigitalGlobe by the National Oceanic and Atmospheric Administration (NOAA) now means that DigitalGlobe will soon be selling imagery at better than 50cm resolution.,which enables ENVI to extract more precise information out of the data. An example below shows a three dimensional depiction of a WorldView-2 derived digital elevation model (DEM) with a pan-sharpened false-colored image overlaid on it.
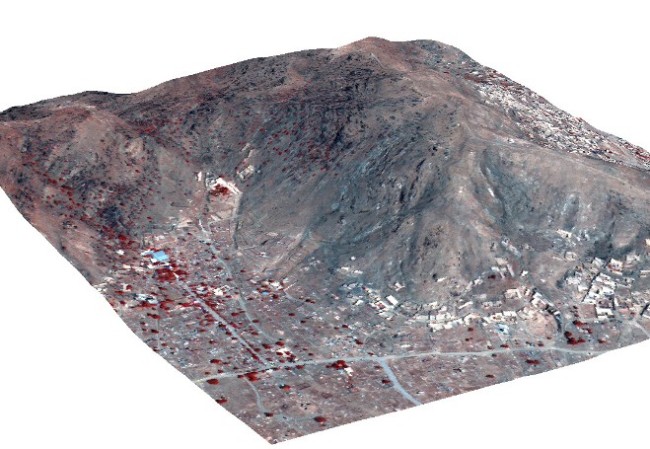
The high spatial accuracy of DigitalGlobe data allows for the extraction of high resolution elevation models for a better understanding of on-the-ground conditions and terrain.
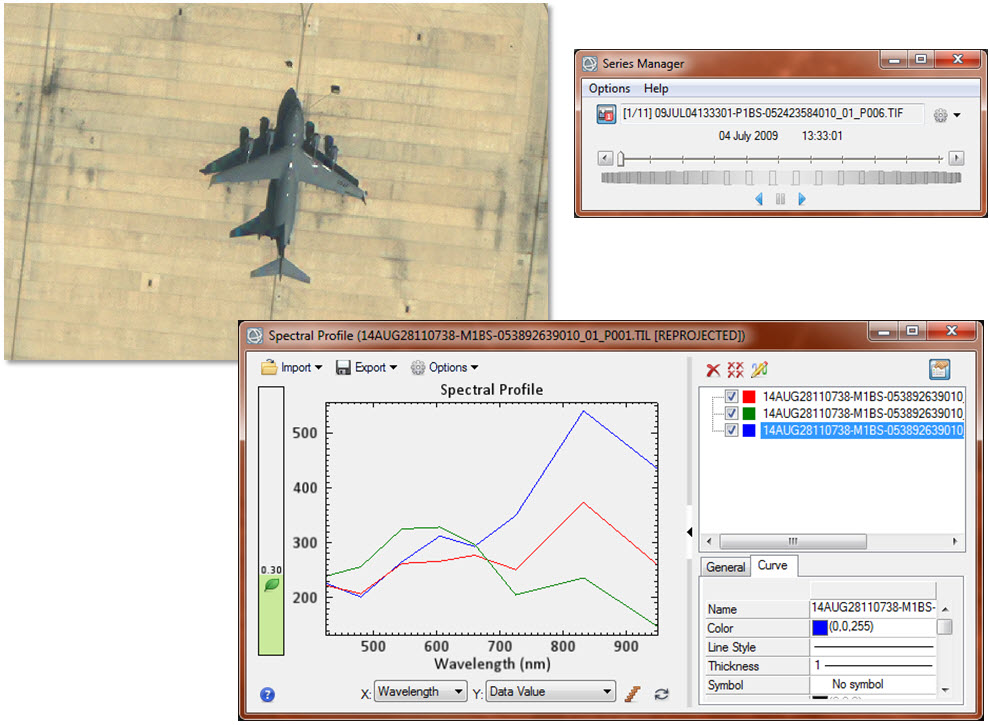
Another quality of the WorldView constellation is the unique spectral bands that are being captured by the sensors. WorldView 2 was the first high resolution satellite to capture data across 8 different imaging bands,and WorldView 3 boasts an impressive 27 bands earning it the title of the world's first super-spectral satellite. ENVI takes advantage of these bands by incorporating sensor-specific spectral indices that can be calculated easily from within the user interface. The latest release of ENVI includes 64 common spectral indices that can be calculated, with 44 of them capable of being run against WorldView data. These indices make it easy to analyze things like soil moisture, water content in a scene, vegetative health, and more. Below we can see a WorldView Improved Vegetative Index overlaid on top of a pan-sharpened WorldView-3 image.
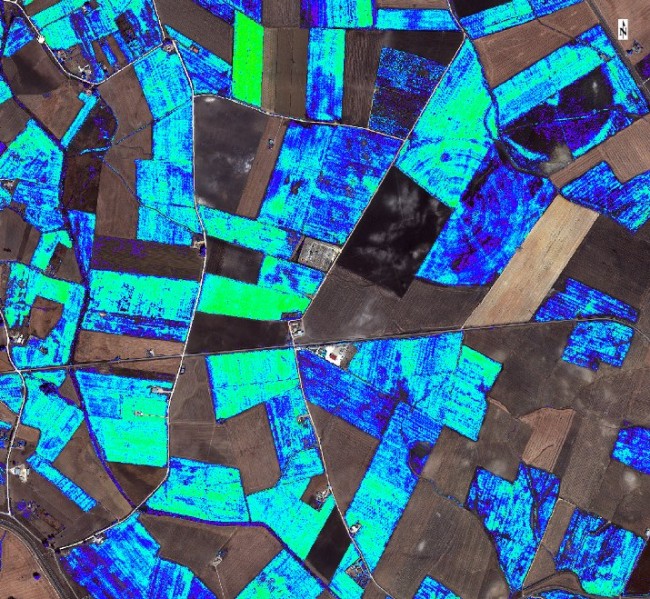
This index takes advantage of the spatial and spectral resolution of the satellite to help us visualize and extract fields or other vegetated areas that are healthy versus those that may need some extra love and attention. Also, full support for spectral libraries means that ENVI can use DigitalGlobe data to accurately target and identify materials such as crop-type, mineral outcroppings, and more.
The final characteristic of DigitalGlobe data I wanted to highlight is the amazing temporal coverage they have over the entire world. The temporal completeness of the DigitalGlobe catalog means that they have the data needed to see and quantify changes that occur on specific areas of the Earth. In the latest release of ENVI, we've created a Spatiotemporal tool box that allows you to quickly and easily create raster time series from multiple images and to display those images as a component of time. Derived products can also be fed into the time series to show a specific analysis over time, or multiple time series can be run and linked together to show how two different image series interact with each other over time. We're really excited about the introduction of this capability into ENVI, and I look forward to seeing how we expand upon our understanding of temporal analytics in an effort to provide more robust solutions to the geospatial analyst.
As DigitalGlobe and Exelis Inc. work together to create the highest resolution, most spectrally unique satellite constellation in existence,our goal is to ensure that ENVI has all of the tools necessary to fully exploit these unique datasets and solve some of the world's toughest problems, geospatial and otherwise.
What do you think? What advantages do you see in the increased spatial, spectral, and temporal content being produced by DigitalGlobe today?
***This blog is based on a Webinar given October 14, 2014 in conjunction with DigitalGlobe Inc. To view the webinar, please feel free to visit http://digitalglobe.adobeconnect.com/p3oz5b2h67f/