PRISM for ENVI: USGS Maps Afghanistan with Hyperspectral Imaging
Natural resource mapping to assist in the economic revitalization of Afghanistan
Anonym
Some of the best examples showcasing the power of remote sensing involve mineral mapping with imaging spectrometers. NV5 (formerly Exelis VIS) is proud to support the U.S. Geological Survey (USGS) in their efforts to assess the natural resources of Afghanistan, as part of their project, "Oil and Gas Resources Assessment of the Katawaz and Helmand Basins."
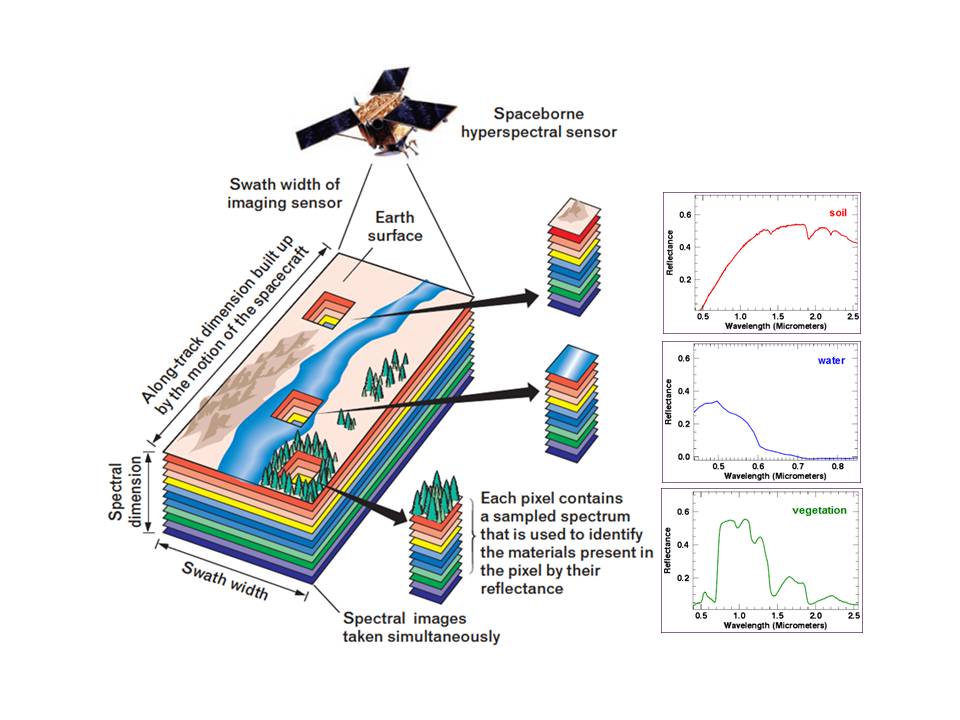
Imaging spectrometers have the unique capability to measure light across the reflected portion of the electromagnetic spectrum, from the visible, to the near- and shortwave-infrared portions of the spectrum. An imaging spectrometer can acquire images in hundreds of registered, contiguous spectral channels, such that for each pixel, it's possible to derive a complete reflectance spectrum (image below). These types of data provide a powerful technique for mapping the distribution and relative abundance of minerals on the Earth's surface.
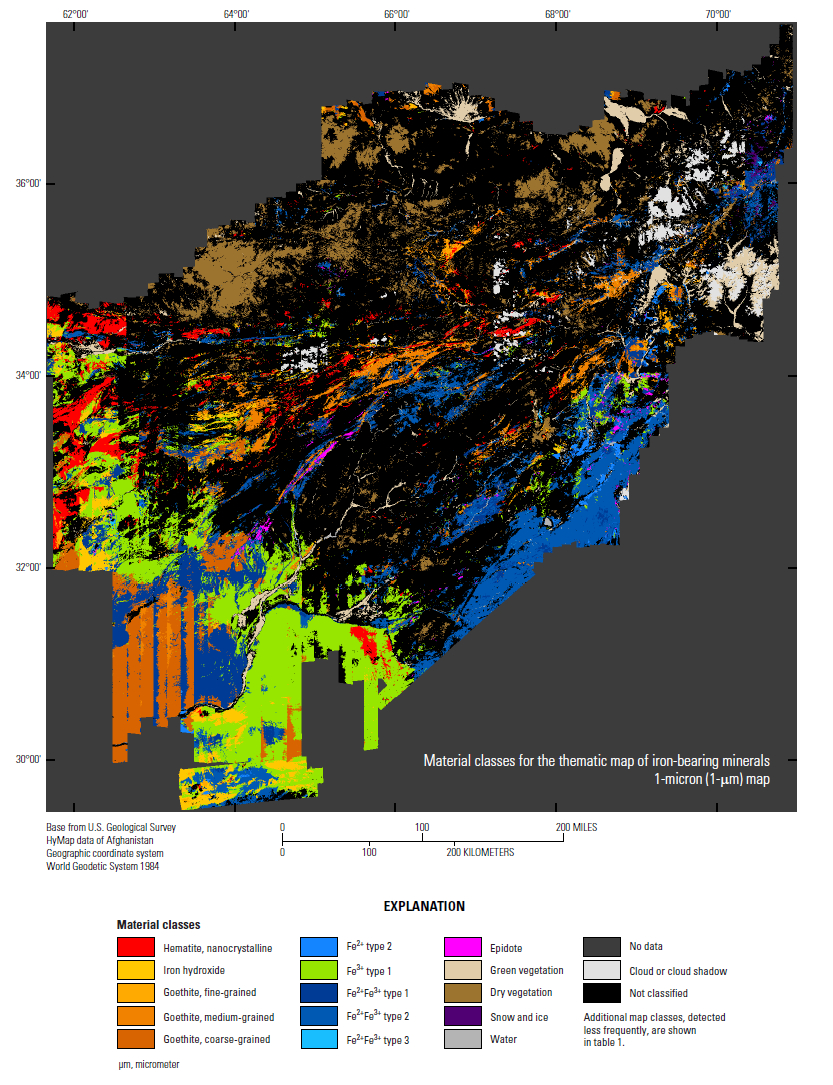
In their recent USGS Data Series Publication, "Surface Mineral Maps of Afghanistan Derived from HyMap Imaging Spectrometer Data," Ray Kokaly, Trude King and Todd Hoefen describe their audacious project to map the majority of Afghanistan, over 438,000 square kilometers, with unprecedented spectral and spatial resolution, using a HyMap imaging spectrometer.
A major part of any project is data preparation and preprocessing, allowing for higher-order analytics that can answer questions. In this paper, Kokaly, et al. provide a helpful and detailed description of their workflow, from raw data acquisition, to georeferencing and reflectance conversion.
It's the downstream analytics that are most interesting. The USGS team created a spectral analytics algorithm called the 'Material Identification and Characterization Algorithm'(MICA), written in the Interactive Data Language (IDL), and deployed as a module within the USGS PRISM (Processing Routines in IDL for Spectroscopic Measurements) software. PRISM is a free add-on to the ENVI remote sensing software, and is available for download here.
The image below shows one of the results from the project, a highly detailed map of iron-bearing minerals and other materials. This figure is a subsampled representation of the entire coverage that shows less than 1/600th the detail in the full resolution data. (Full resolution digital maps suitable for incorporation in a GIS can be downloaded here.) Iron ores can be found in association with other valuable deposits like emeralds and silver, so these maps are being applied to natural resource development, mapping previously unknown occurrences of minerals that suggest mineralization and potential targets for resource development. The USGS study is an initial step in realizing the potential offered by cutting-edge remote sensing technology in defining mineral distributions to assist in the economic revitalization of Afghanistan.