Remembering the Colorado Floods: One Year Later
Anonym
This week marks one year since a major flood event wreaked havoc on communities up and down the Front Range of Colorado. Our home county of Boulder, Colorado, was one of several counties in the region that was left devastated after a week of heavy storm activity brought over 17 inches of rainfall to the region. Localized flash flooding events caused major damage to roadways, bridges and buildings - and caused many rivers throughout the county to create new channels.
Many events have been taking place throughout the week to commemorate the flood event and to evaluate how far the communities that were most affected have come in rebuilding. Many of the communities that were hit the hardest were located in the western portion of our county, where steep topography, narrow canyons and a landscape that had been stressed by years of successive forest fire activity left the area ripe for this type of disaster. This morning on my way to work there was a great story on the local radio station about just how far these communities have come. Most of the infrastructure that was damaged has been rebuilt. In the small town of Jamestown, which was left a virtual ghost town after this event, about 90% of the residents have returned.
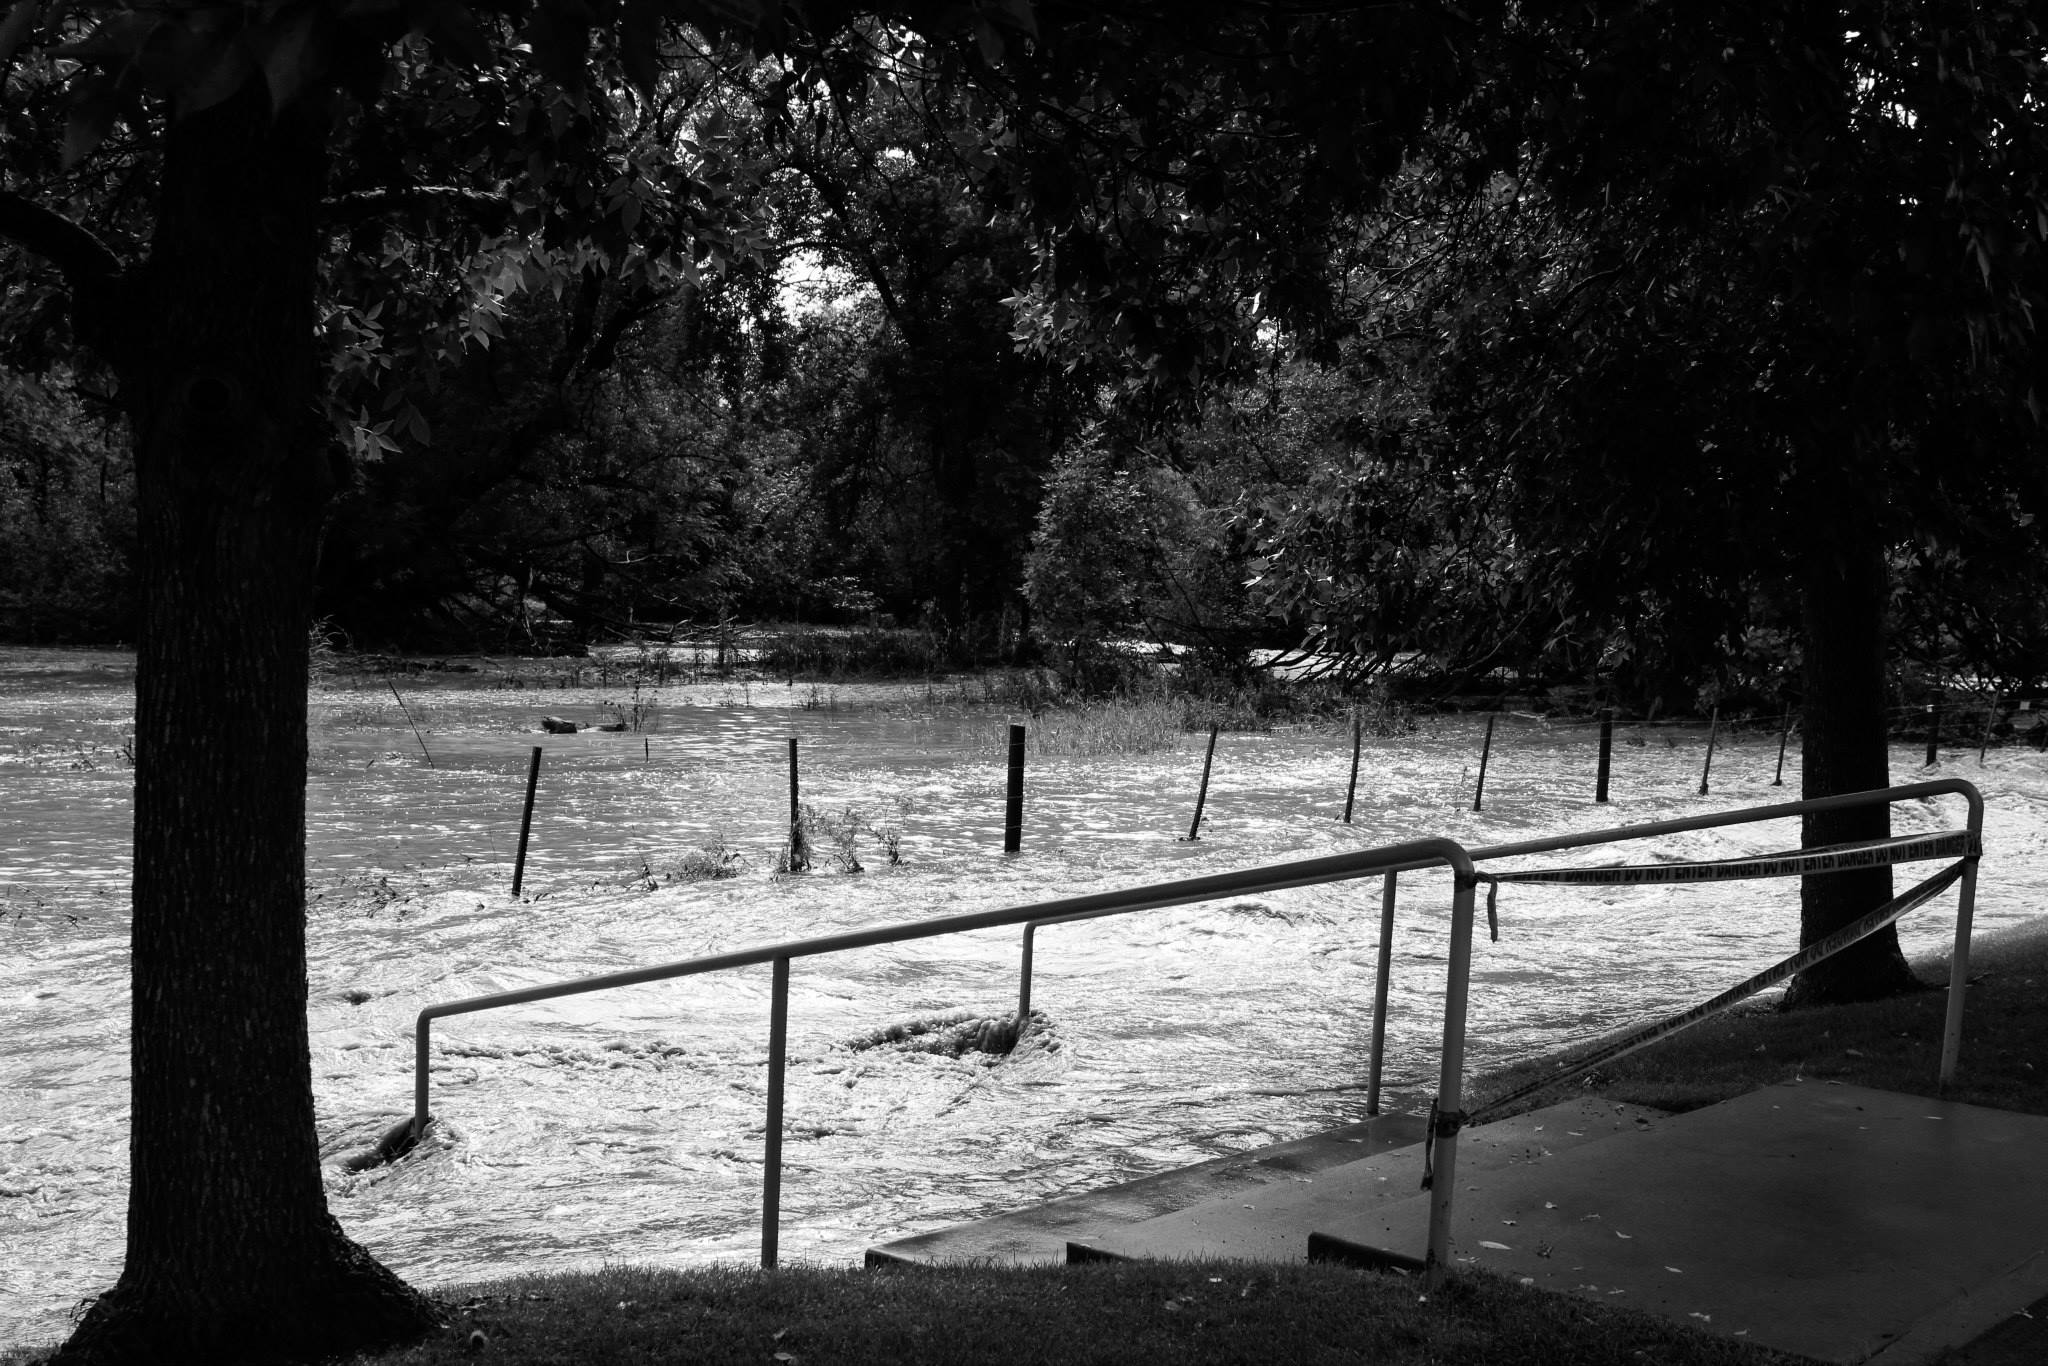
What has been most interesting about this event, from my humble perspective, is how even though we can rebuild, the landscape of our region will be forever changed. One example of this would be right outside our office where water coming out of the mountains washed across the floodplain, depositing several feet of sediment on the landscape. To give you an idea of what this was like, the image below was taken during the flood on September 10, 2013. The image shows the bike path right outside of our office with an open space area just beyond the path (on the far side of the fence posts). When the flood waters receded, we were left with so much sediment and debris that heavy equipment was needed to clear the bike path.
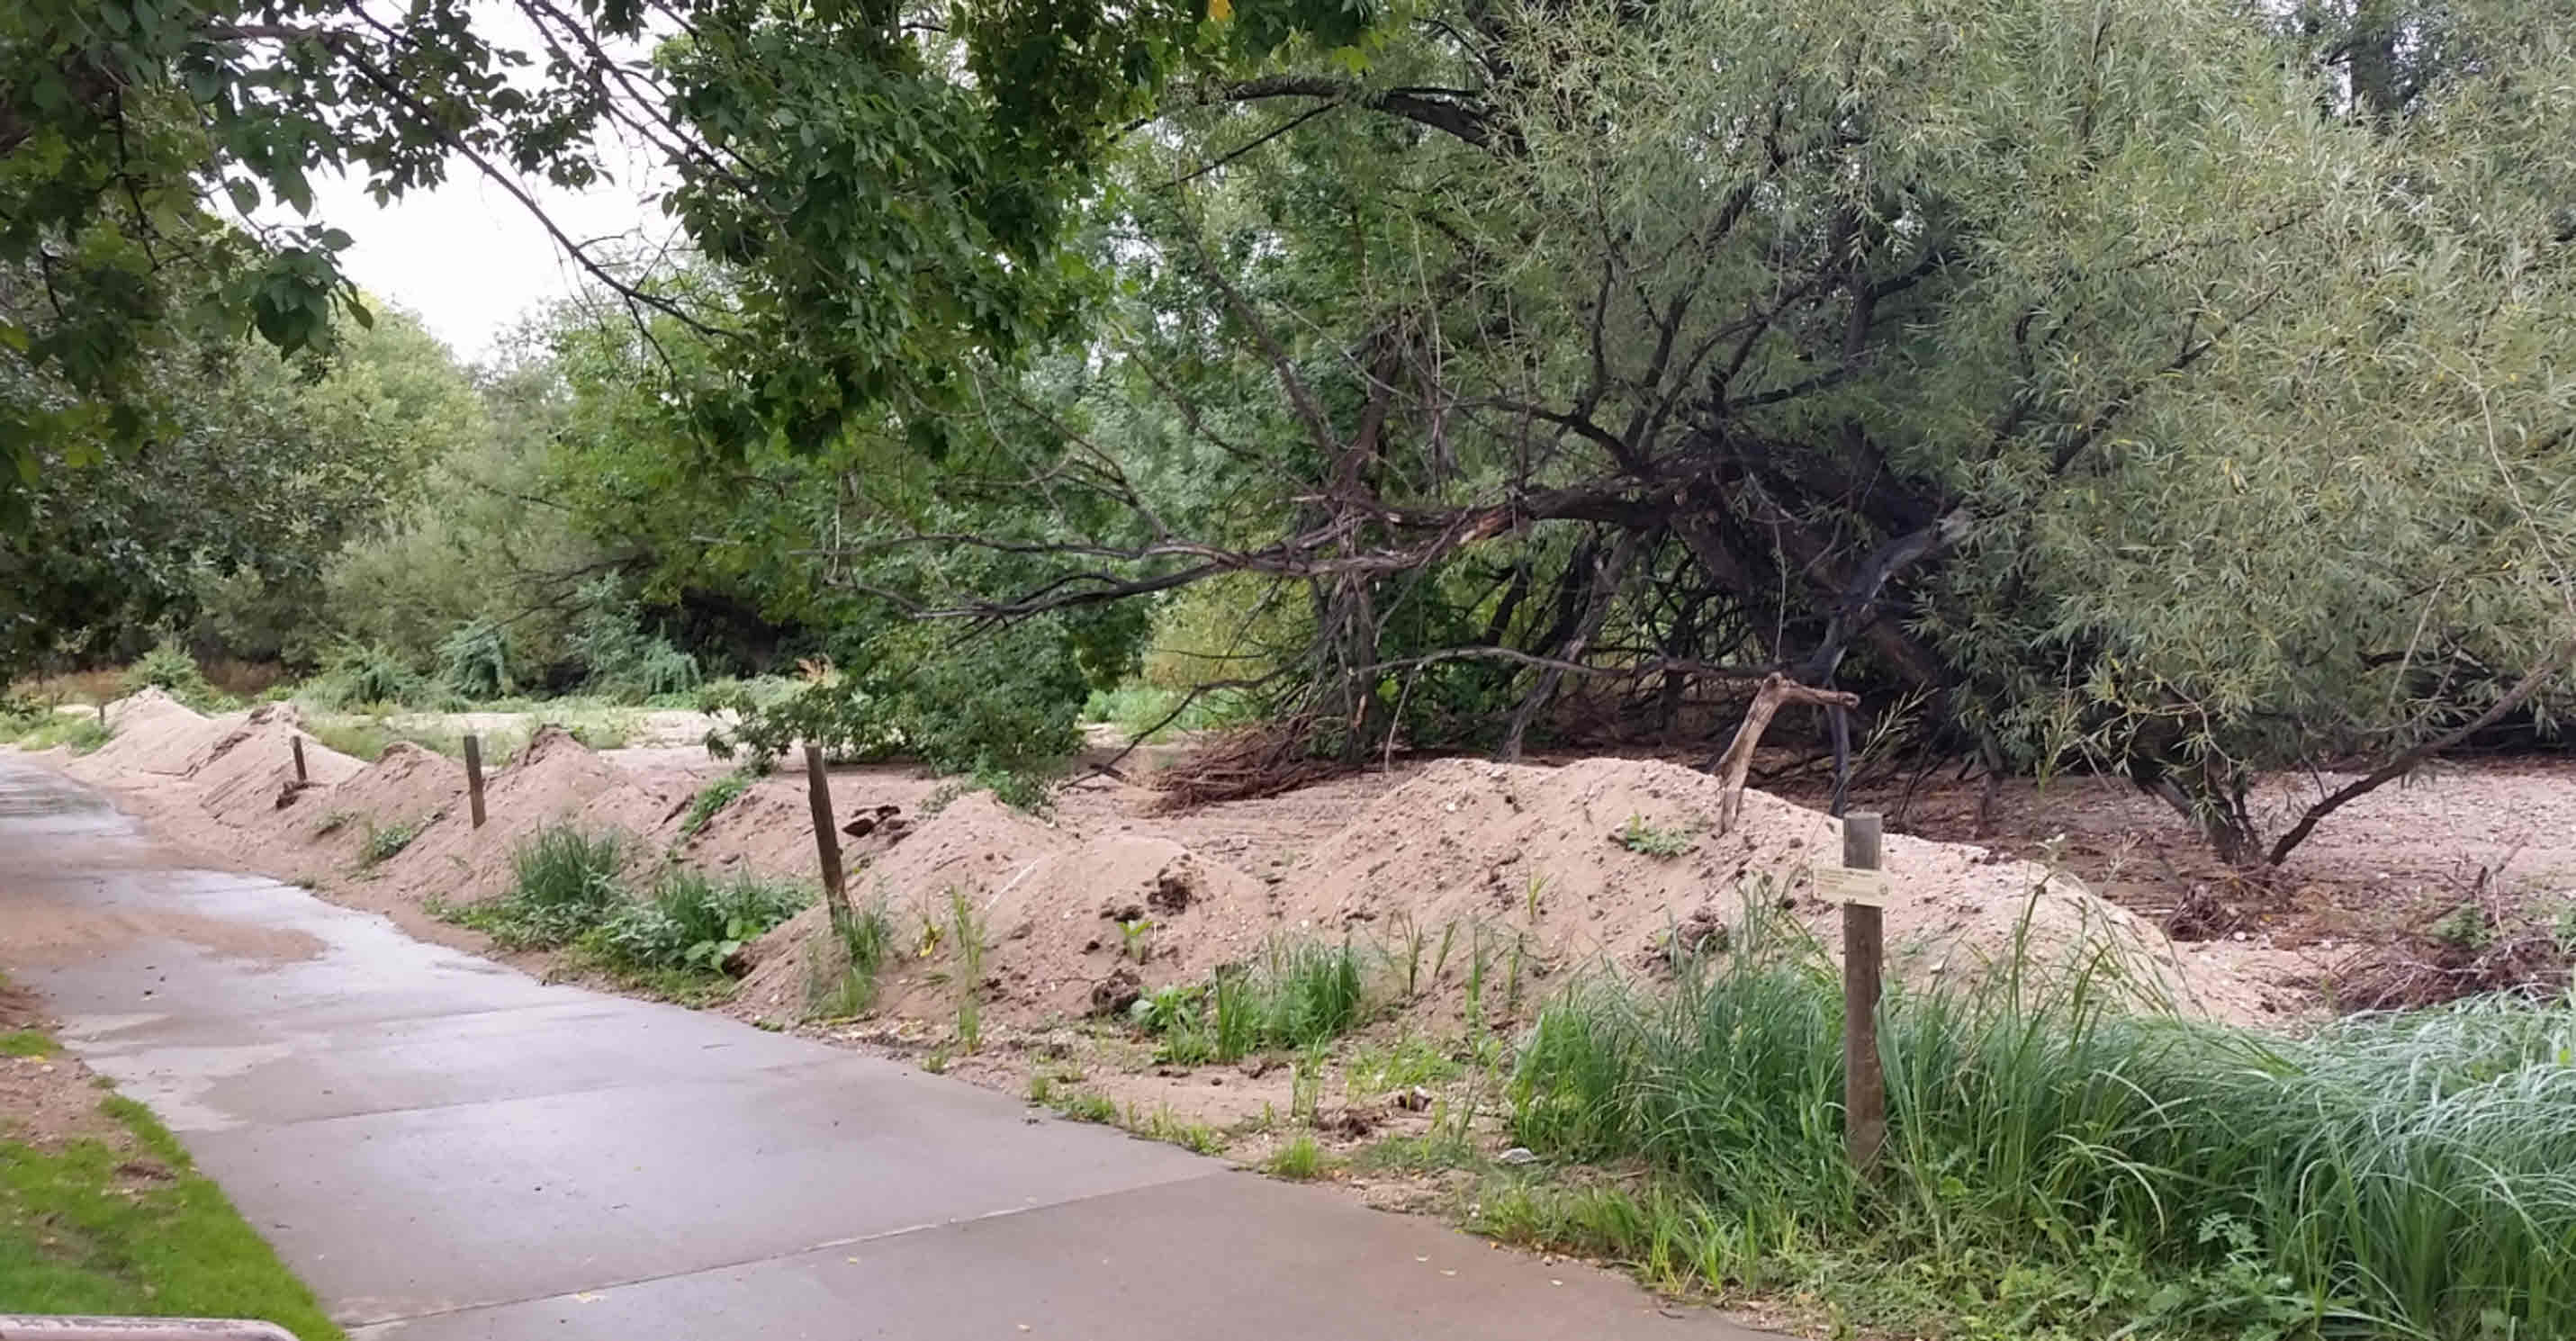
One year later, the sediment has been cleared from the bike path, but the open space area is now several feet higher than it had previously been. The open space area that was once lush with vegetation now looks more like a beach, though vegetation has slowly been finding its way back to the area throughout the summer. The image below was captured on September 11, 2014.
Scenes like this are very common throughout the county. Many of the local hiking and biking trails have been rerouted to accommodate the changes to our landscape. In some areas, small drainages have grown to resemble small canyons. All of this change has had me thinking a lot about how we can use remote sensing techniques to quantify the affects of this flood event. In the video at the top of this blog post I talk about a tiered assessment strategy for managing impact analysis. A tiered assessment strategy for managing impact analysis provides GIS analysts with a framework for honing in on the areas that are most affected by an event. Remotely sensed data is often the first source of accurate and verifiable geographic information to become available after an event has occurred. Check out the image below for a breakdown of how a tiered assessment strategy would be implemented to make use of the valuable information provided by remotely sensed data.
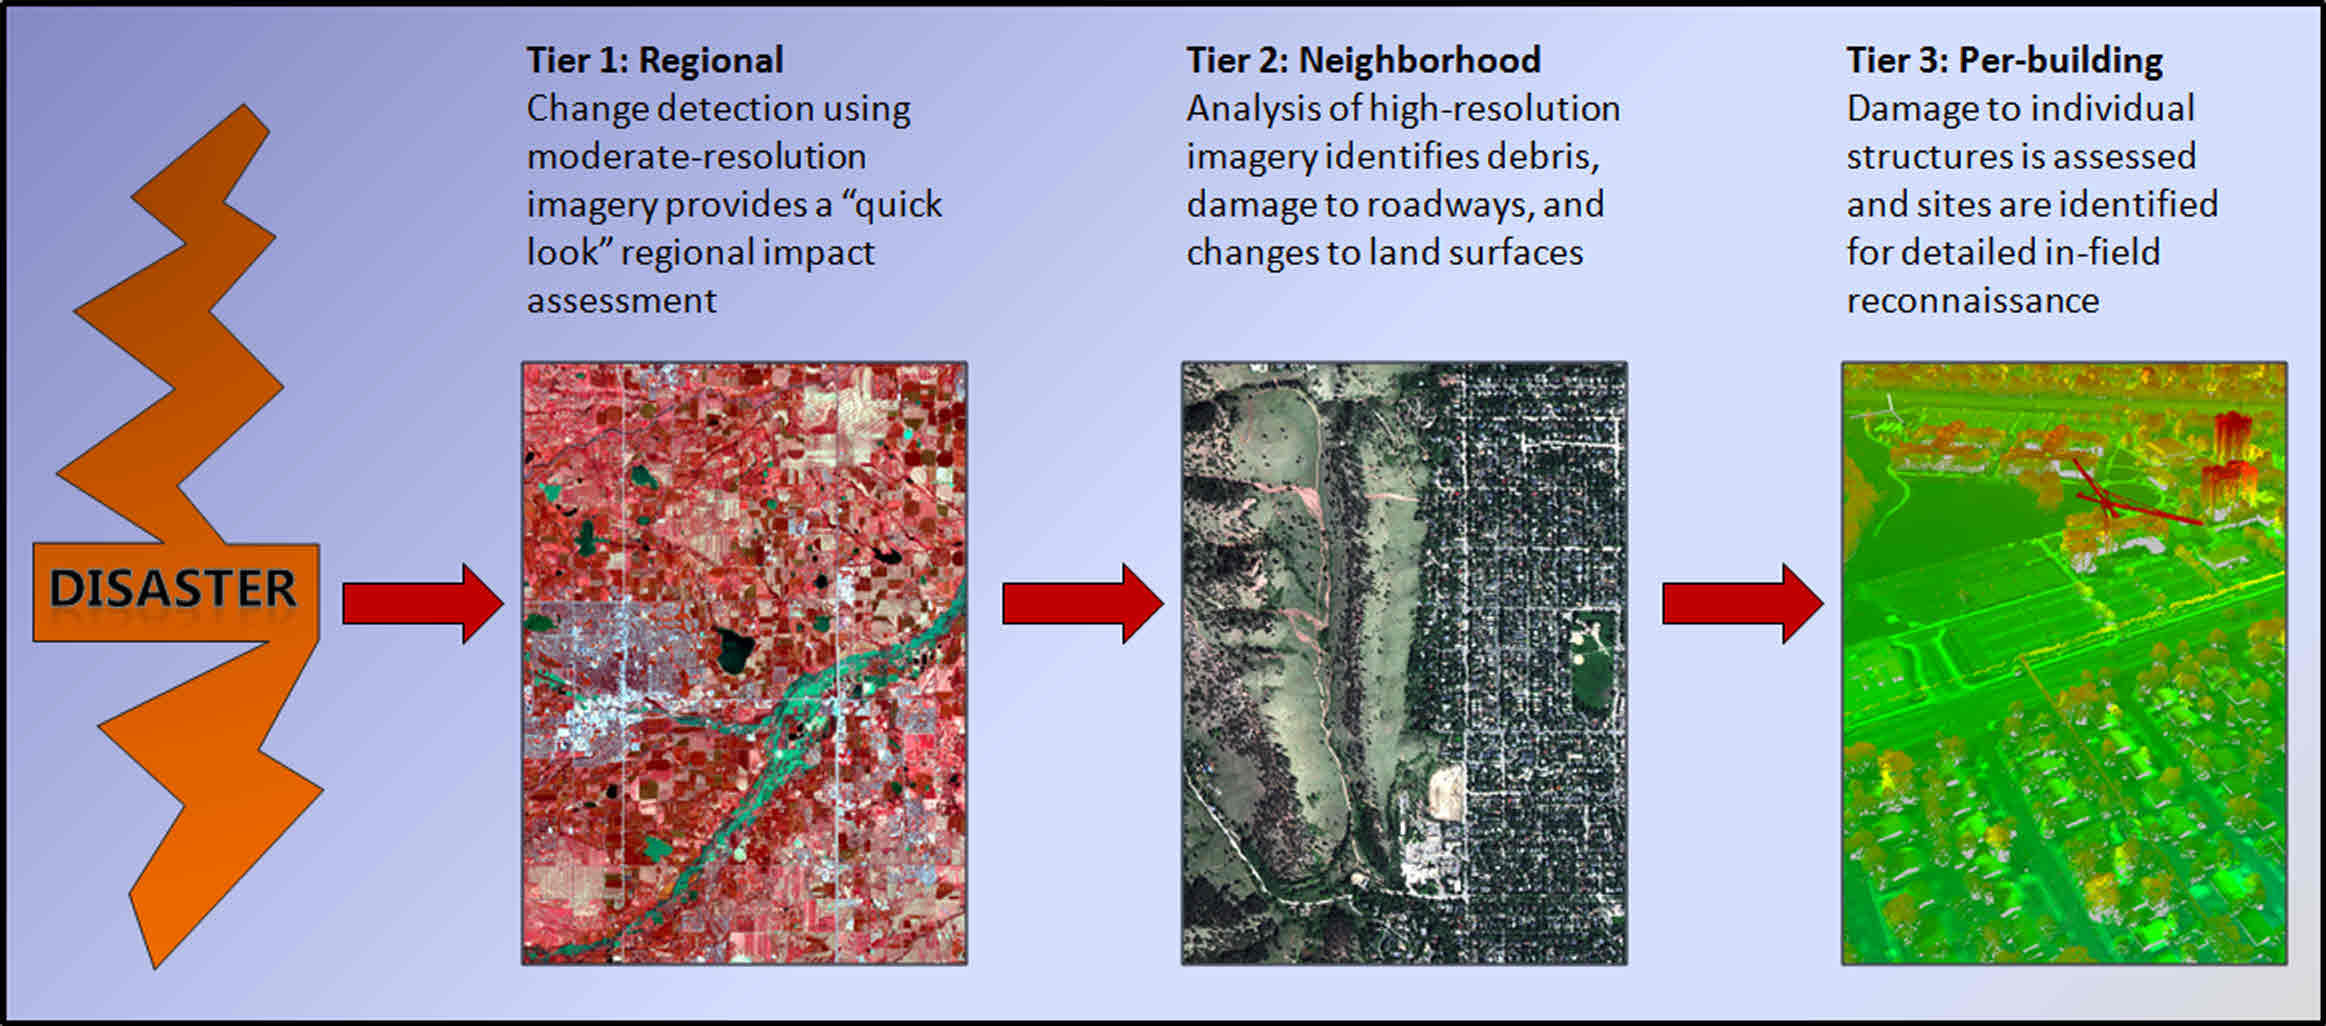
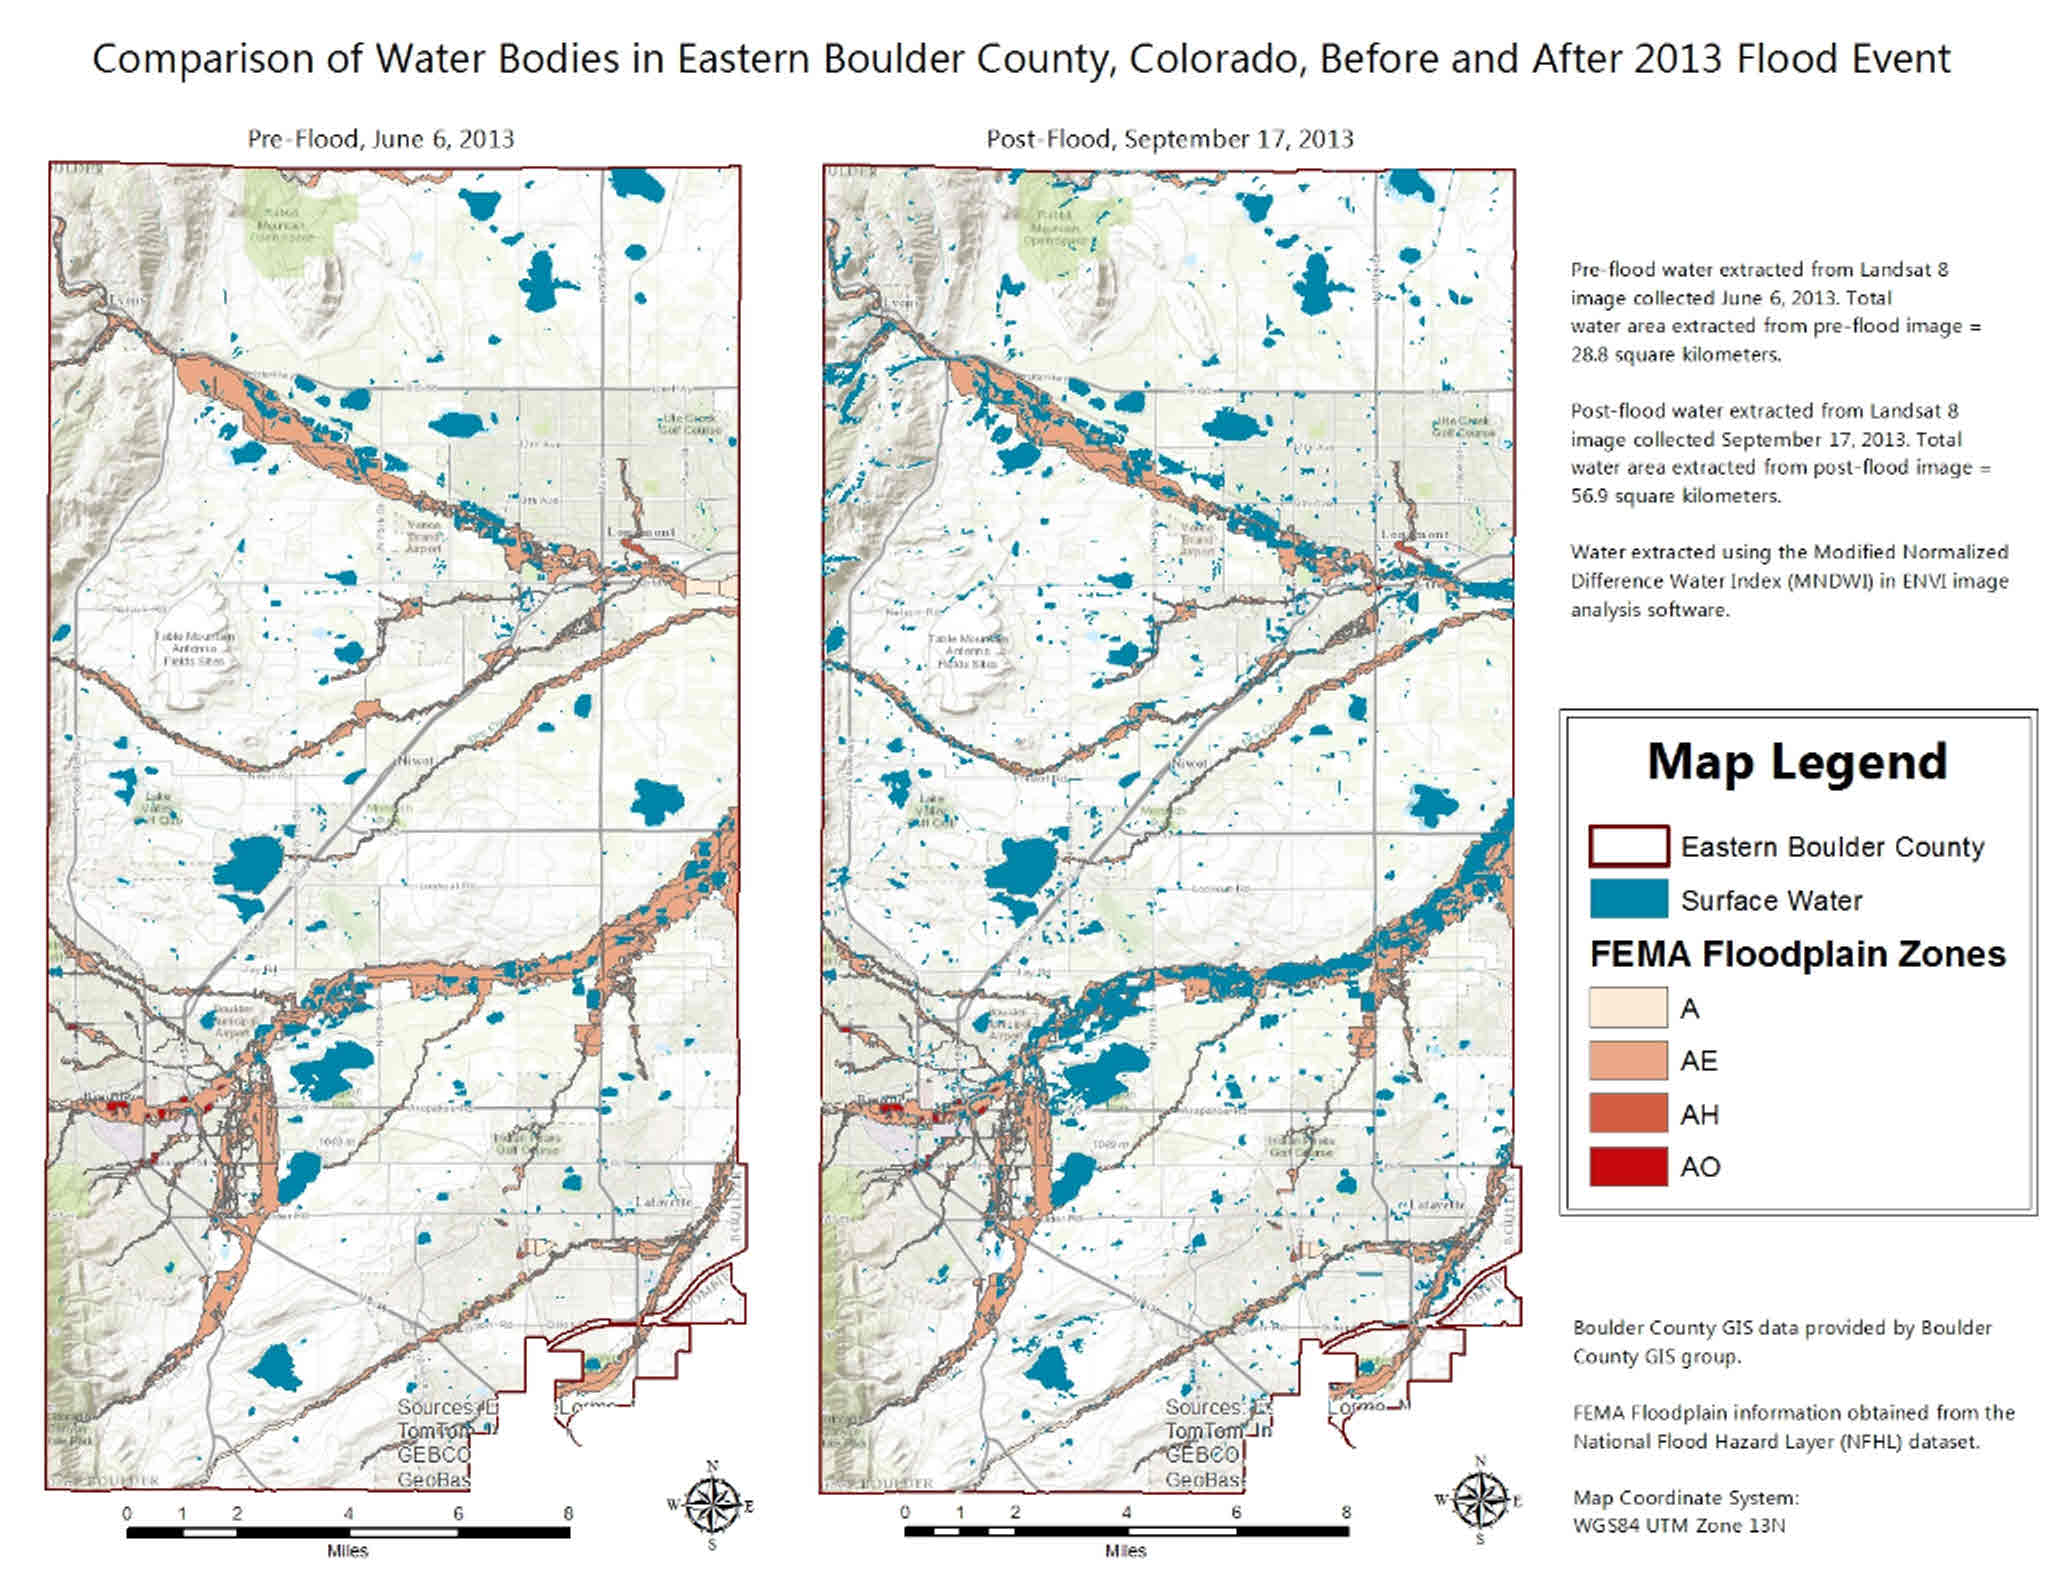
At tier 1, regional assessment using moderate resolution imagery can be used to provide a "quick look" at the impact a disaster has had on a region. Check out the map below to see how Landsat 8 OLI imagery was used to extract surface water from pre-flood and post-flood images to get an understanding of how the flood impacted our region.
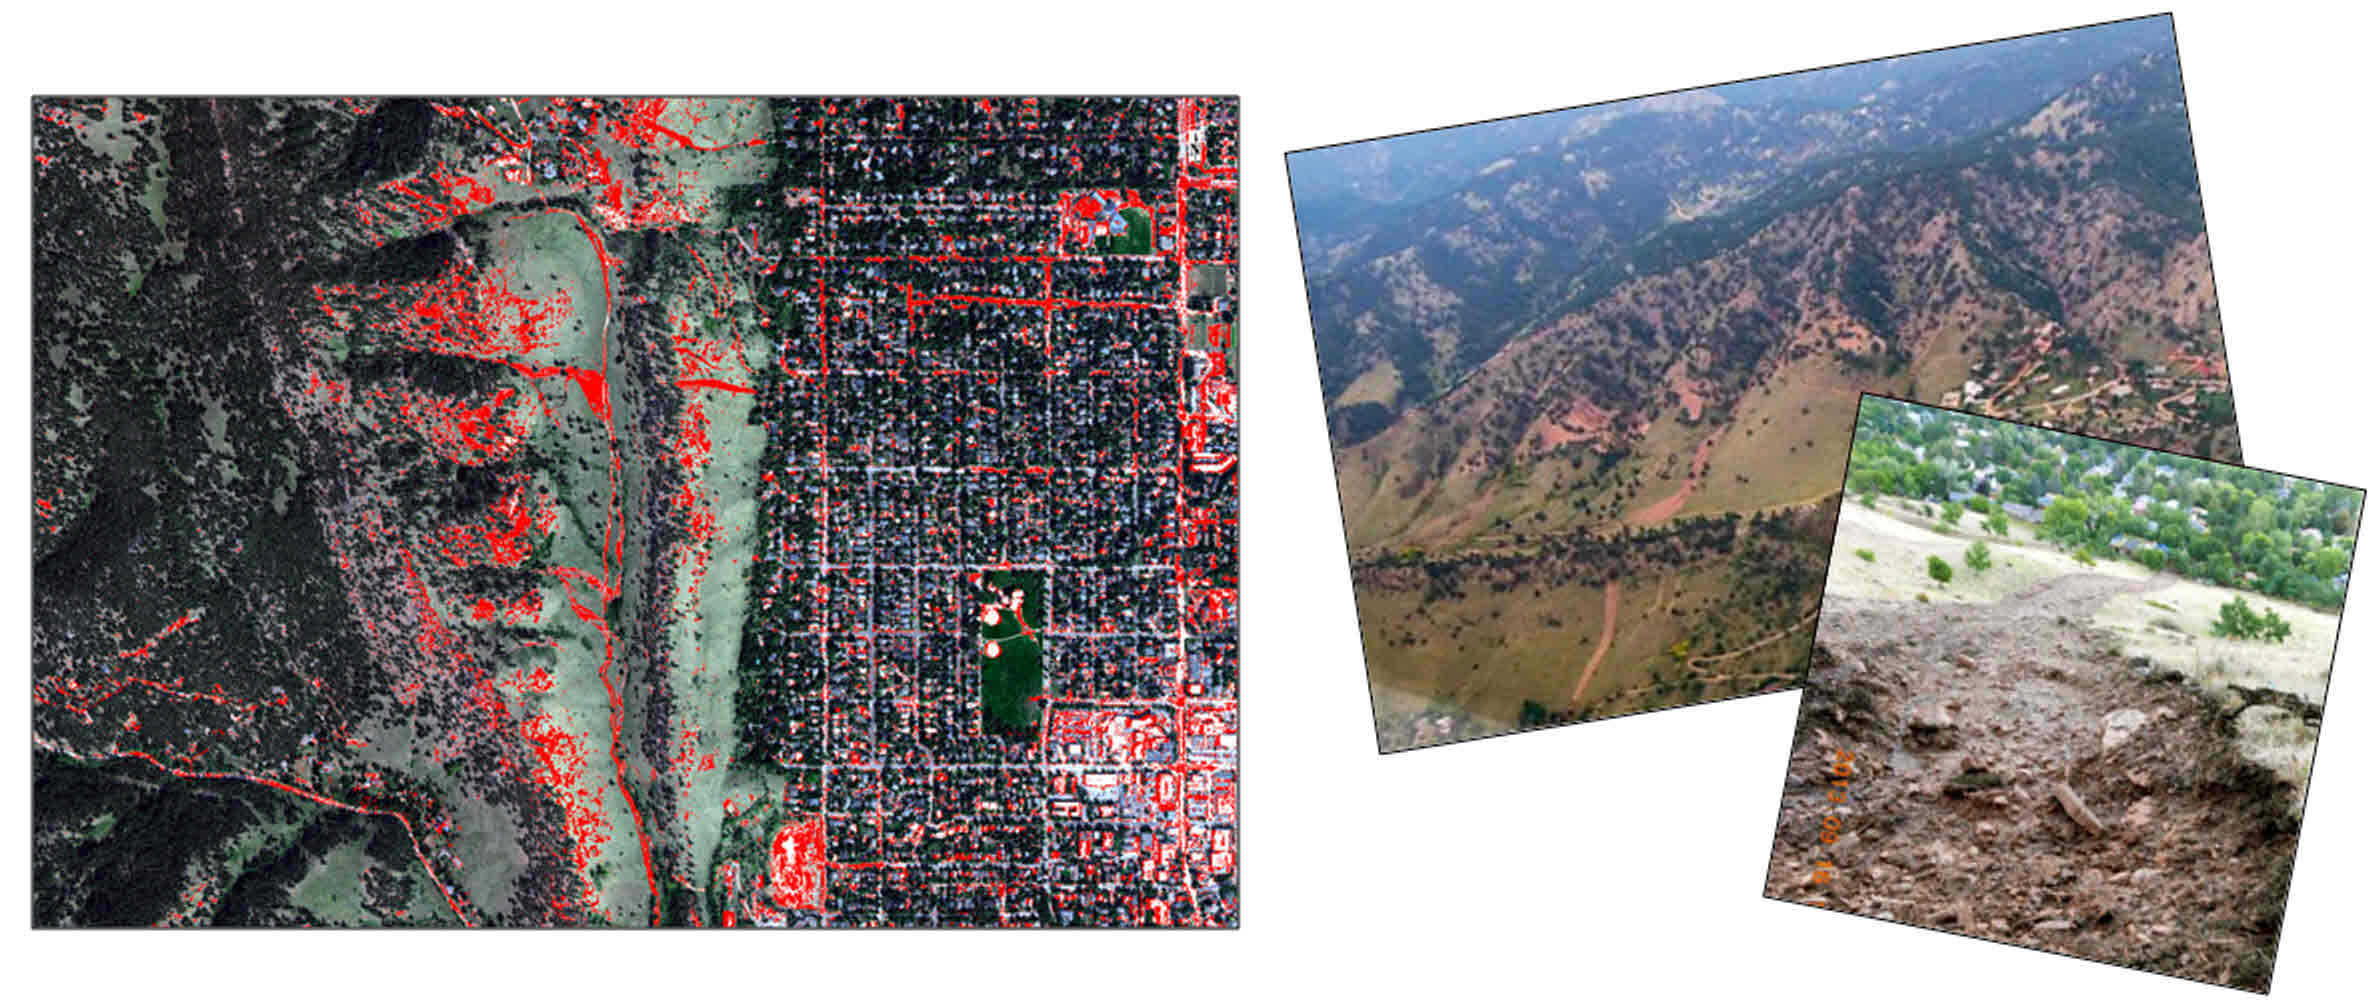
At tier 2, neighborhood assessment using high-resolution imagery obtained from platforms such as WorldView-2 from DigitalGlobe can give us the ability to identify sediment deposits, debris, landslides, damaged roadways, and damage to structures. Check out the image below to see how thematic change detection techniques applied to before and after WorldView-2 imagery were used to identify landslides, mud and sediment that was washed into a neighborhood in Boulder, Colorado.
This all leads me to tier 3 assessment, which one year later I feel is still under way. Tier 3 assessment, which relies on very high resolution remote sensing platforms, is something that I see expanding exponentially in the coming years. With sources such as LiDAR and synthetic aperture radar (SAR), we can truly begin to look at damage to individual structures and look at minute changes to elevation. With high resolution elevation data we can measure the changes I mentioned observing earlier, such as the elevation changes brought about by erosion of stream channels and deposition of sediment along the floodplain. We are also beginning to see the emergence of unmanned aerial vehicles (UAVs) for gathering geographic information. All of these unique sources of information can provide a very detailed picture of the changes to our environment brought on by a natural disaster such as the flood event that rocked our community here in Colorado one year ago. While we cannot prevent these types of events from occurring, using the latest technology to help respond to these events and learn from what we see is an important aspect of why many of us are in this field to begin with.